The following data is provided for persons who wish to view the details of reference documents related to items discussed thus far.
Table 1: Changes in the global production amount of oilseeds (10 main types of oilseeds)
(Unit: 1 million tons)

Source: Annual reports "Oil World" by ISTA Mielke. The same sources are used for the following 20 tables.
Table 2: Main producing countries of main oilseeds
(Unit: 1,000 tons)
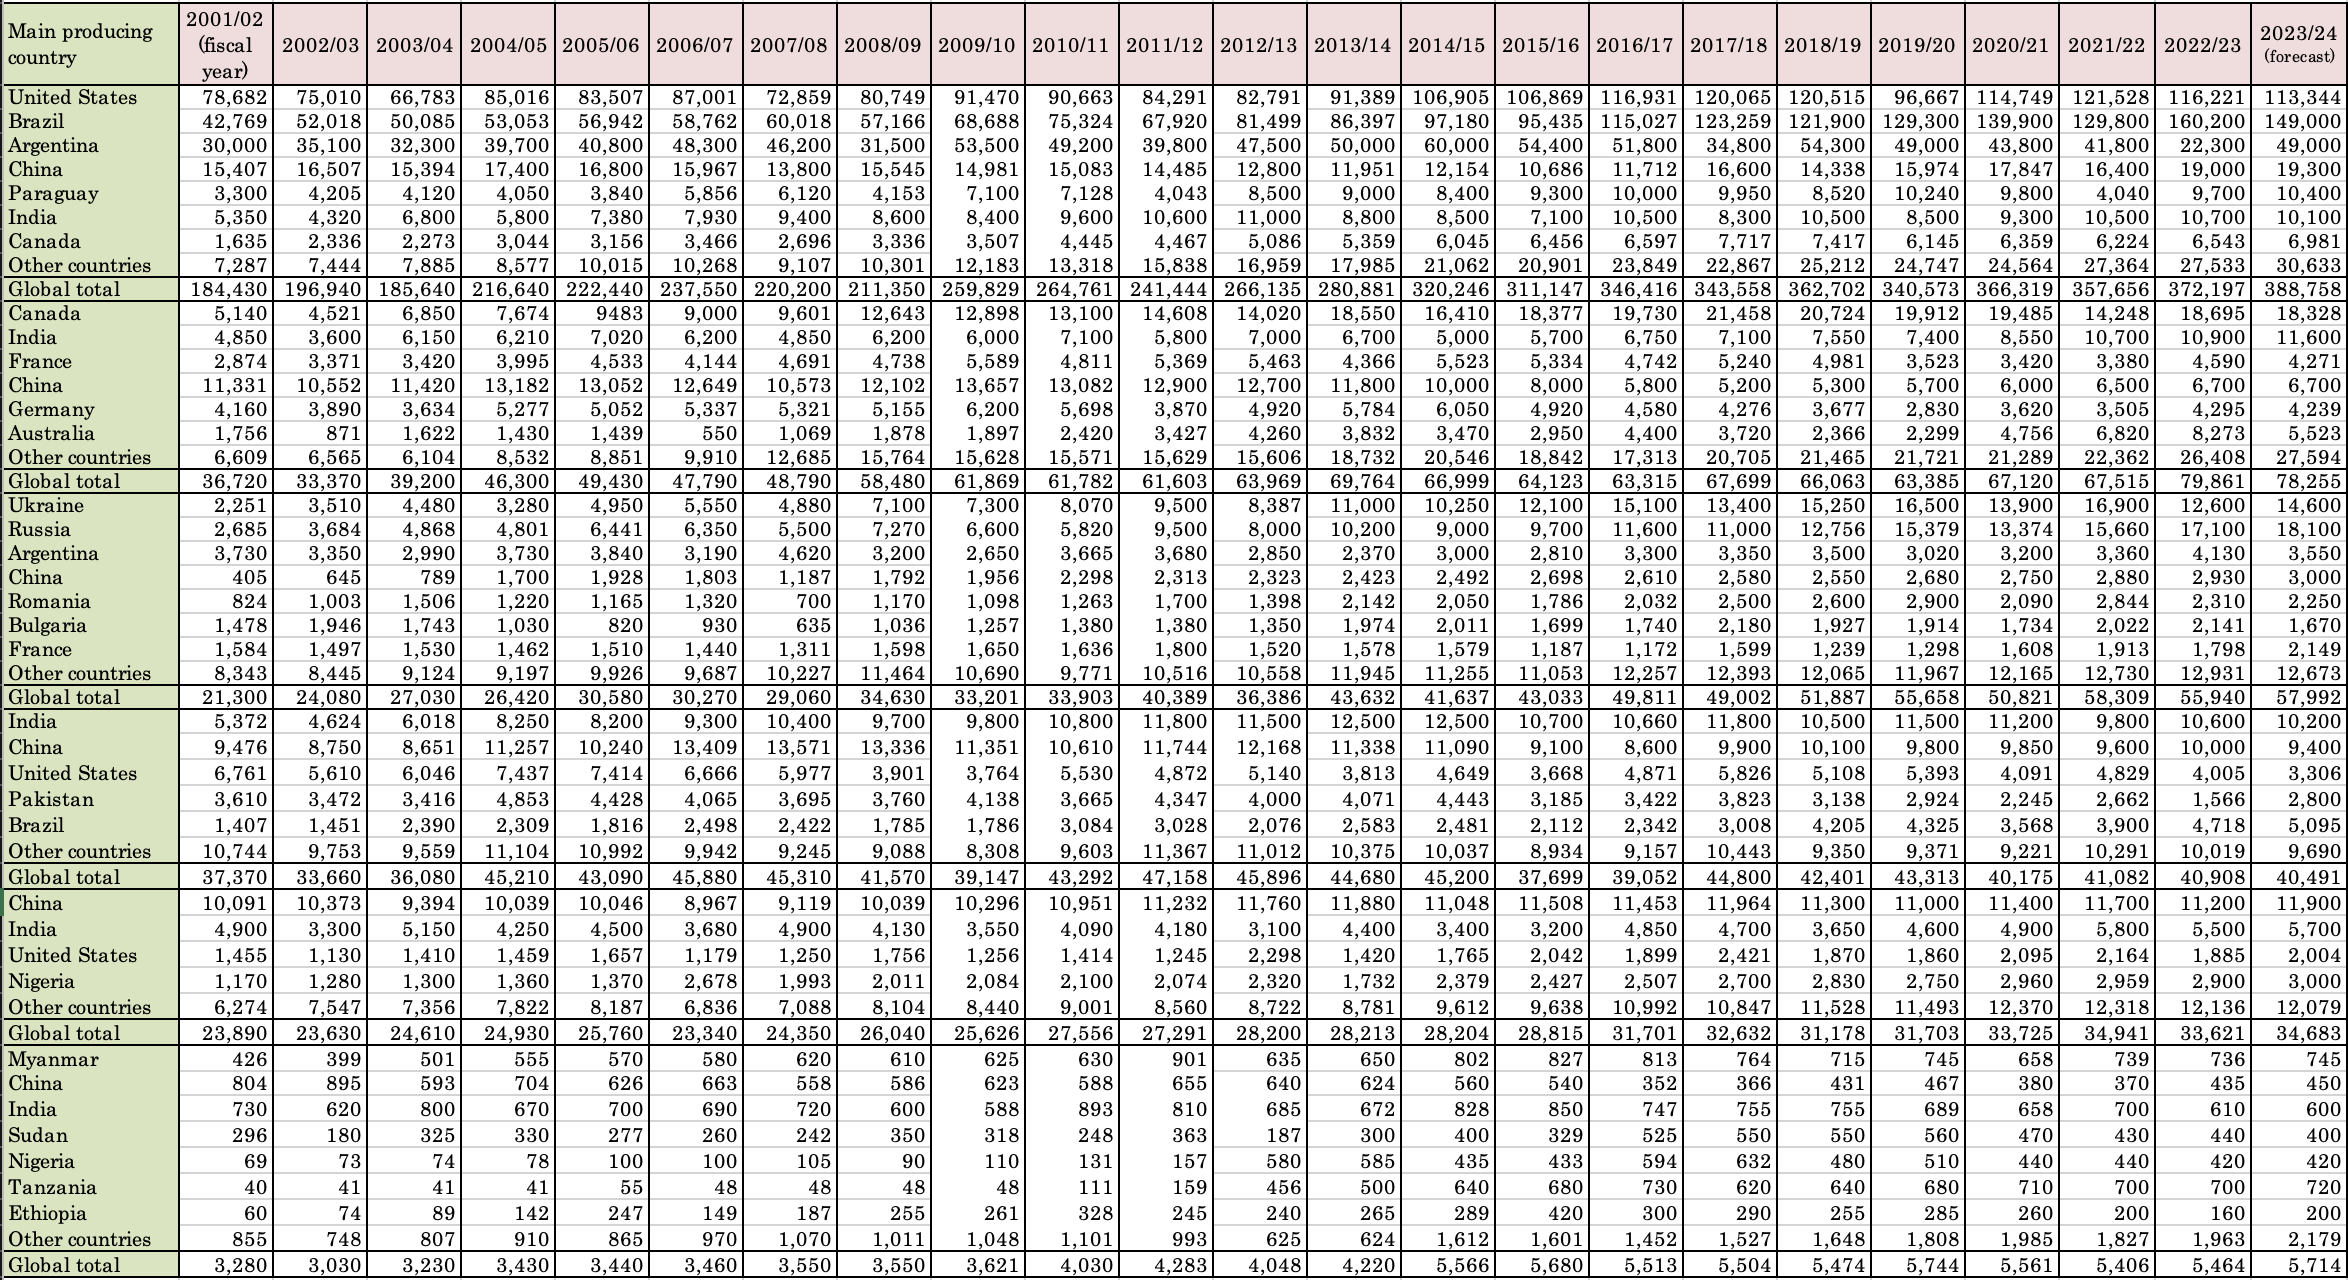
Table 3: Changes in the export amount for main oilseeds
(Unit: 1,000 tons)

Table 4: Changes in export amount for soybeans and rapeseeds by main country
(Unit: 1,000 tons)

Table 5: Changes in import amount of oilseeds, soybeans, and rapeseeds by main importing country
(Unit: 1,000 tons)
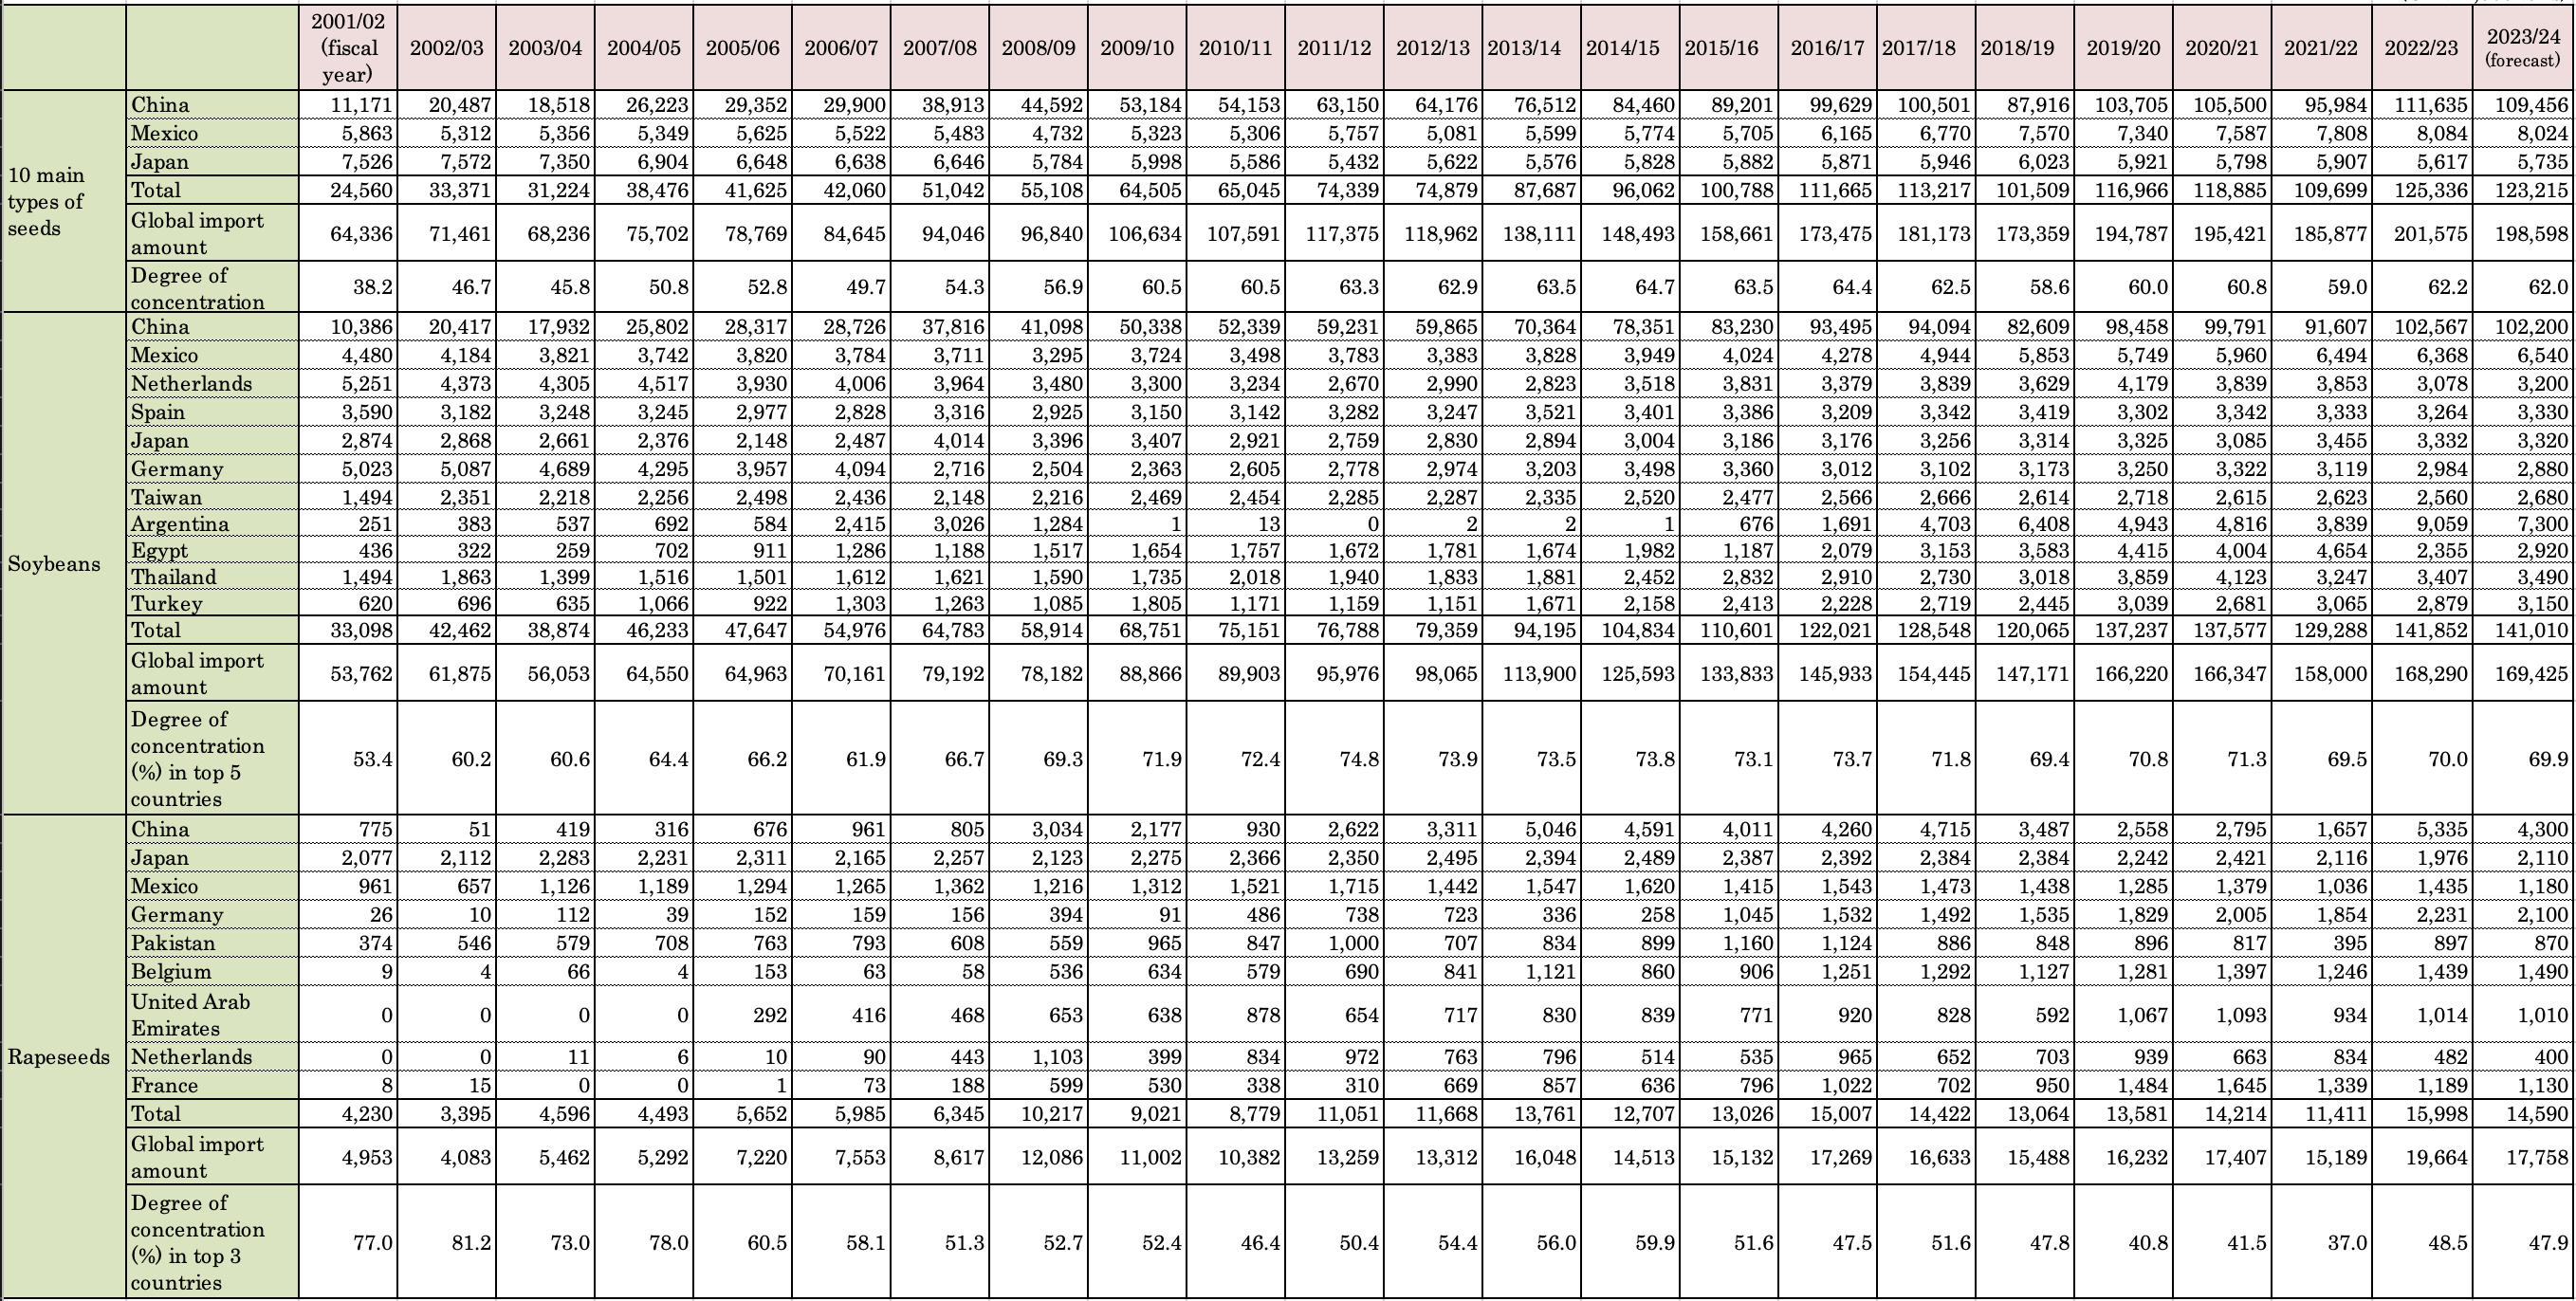
Table 6: Changes in expression amount for main oilseeds
(Unit: 1,000 tons)

Table 7: Changes in the expression amount of main oilseeds by country
(Unit: 1,000 tons)
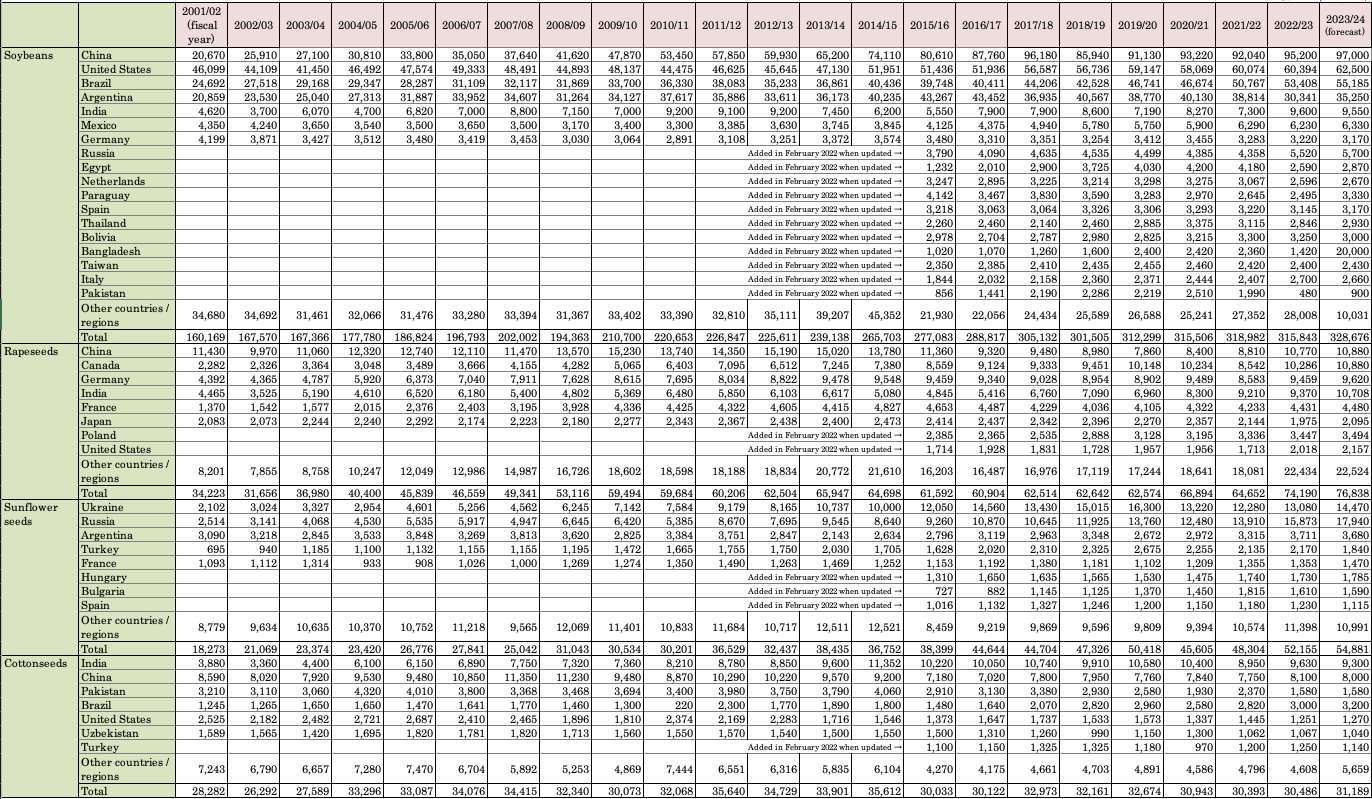
Table 8: Changes in the product amount for 13 main types of oil
(Unit: 1,000 tons)

Table 9: Changes in the production amount for 10 main types of oils by main countries
(Unit: 1,000 tons)
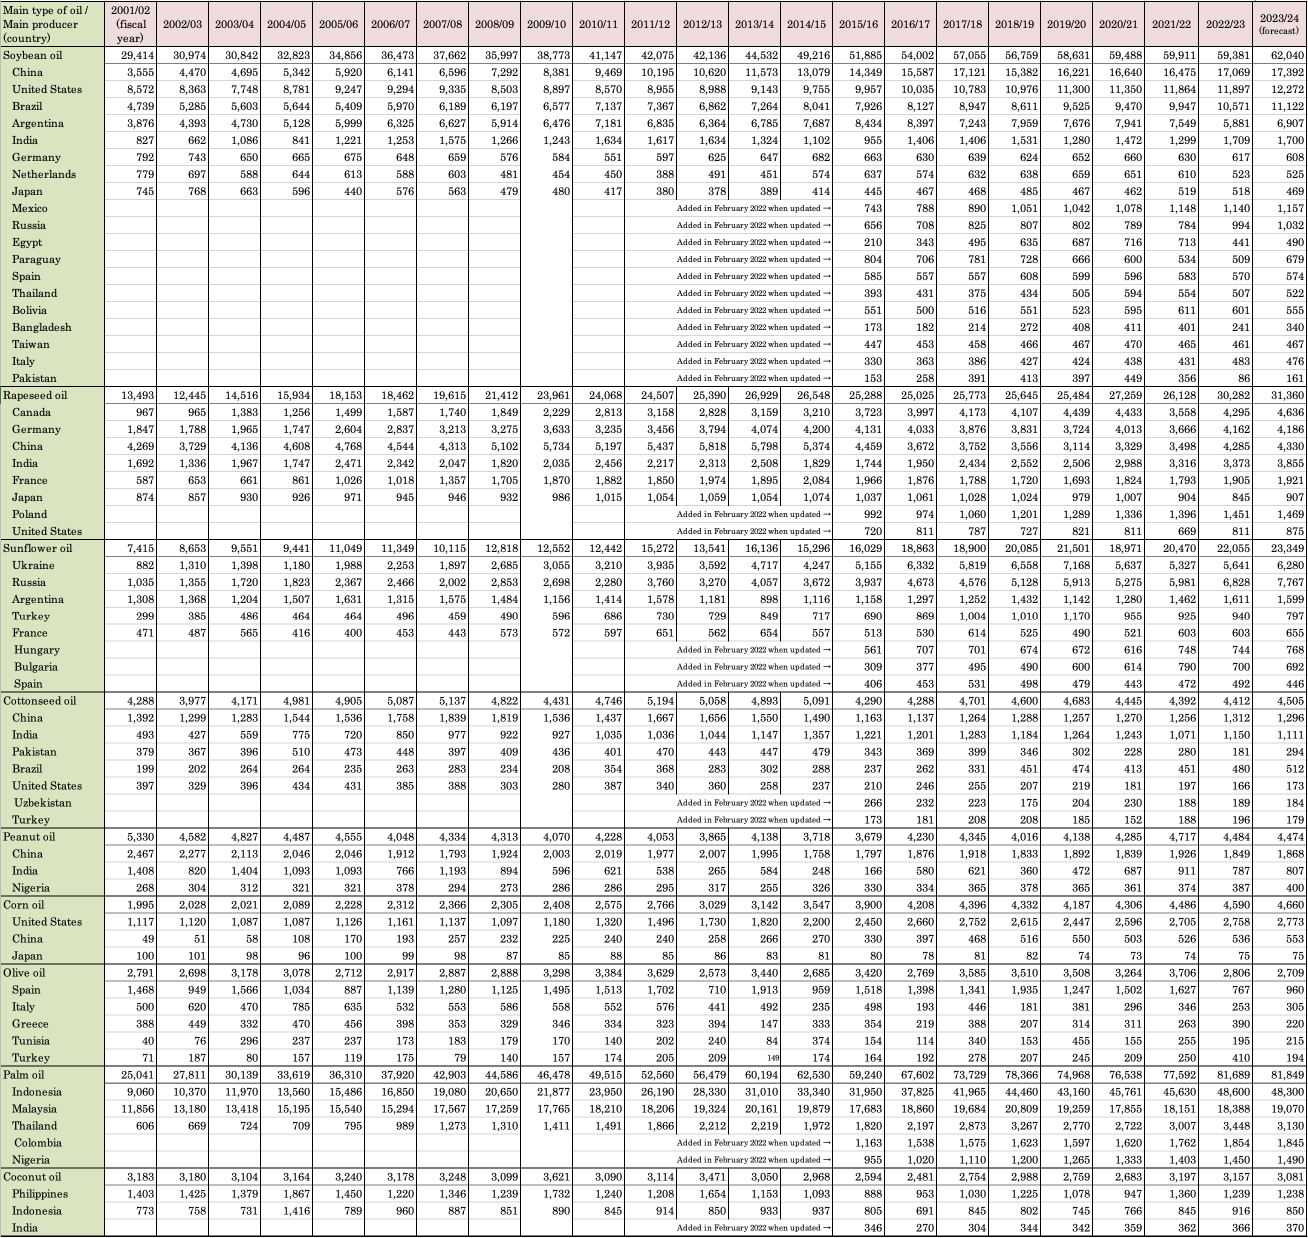
Table 10: Changes in export amount for 13 main types of oil
(Unit: 1,000 tons)

Table 11: Changes in export amount of main oils by country
(Unit: 1,000 tons)
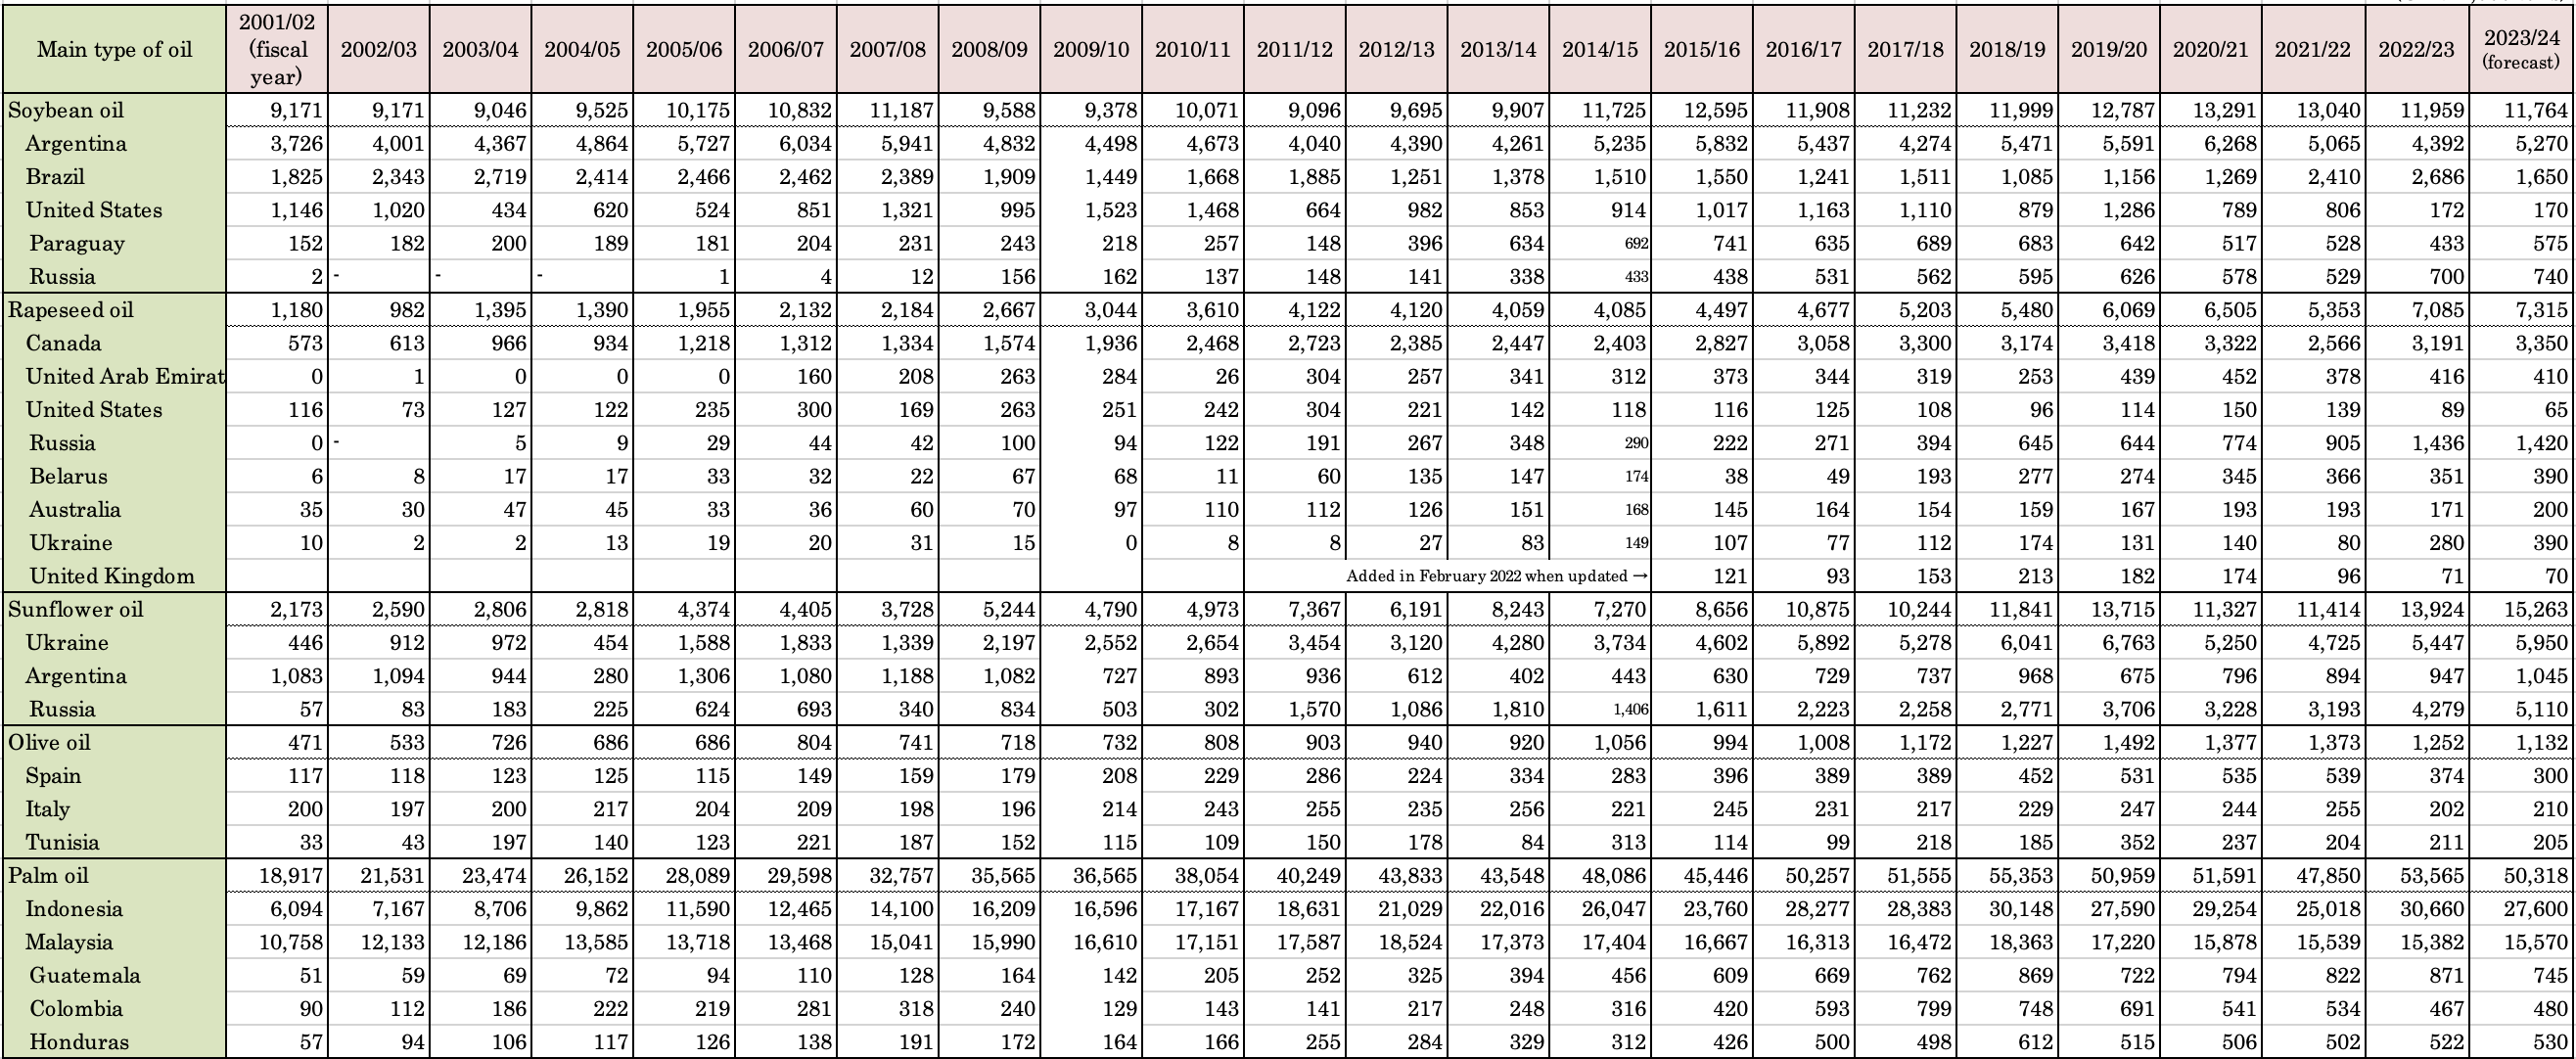
Table 12: Changes in import amount of main oils by country
(Unit: 1,000 tons)
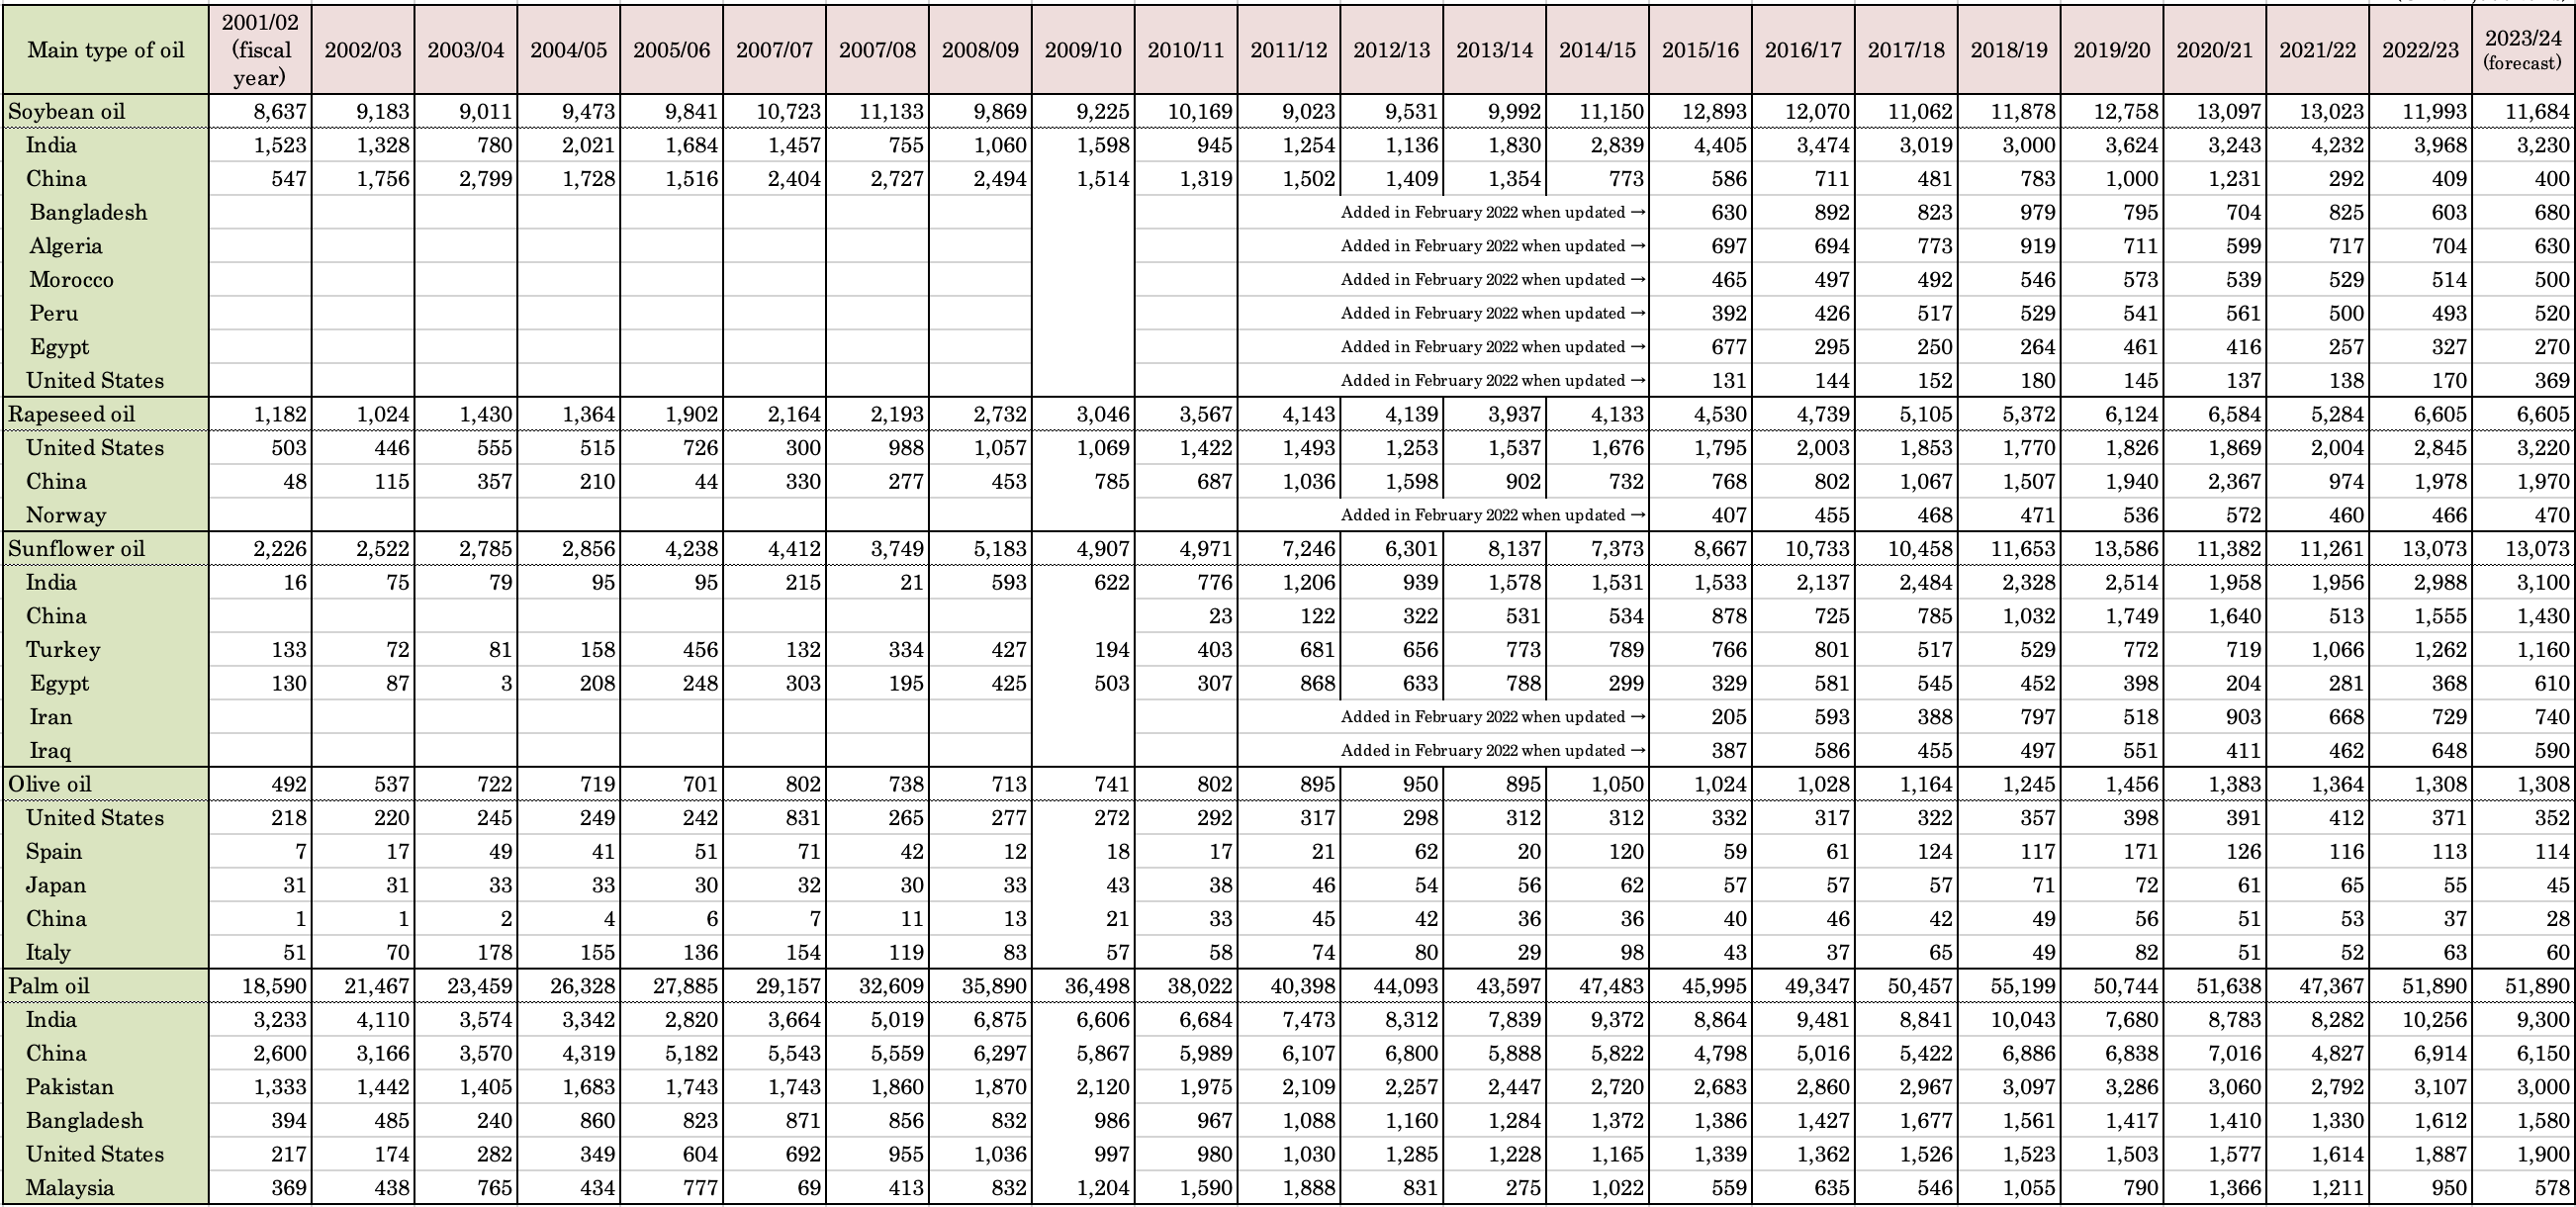
Table 13: Changes in consumption amount for 13 main types of oil
(Unit: 1,000 tons)

Table 14: Amount of consumption in main countries by type of oil
(Unit: 1,000 tons)
(Fiscal 2021/22)
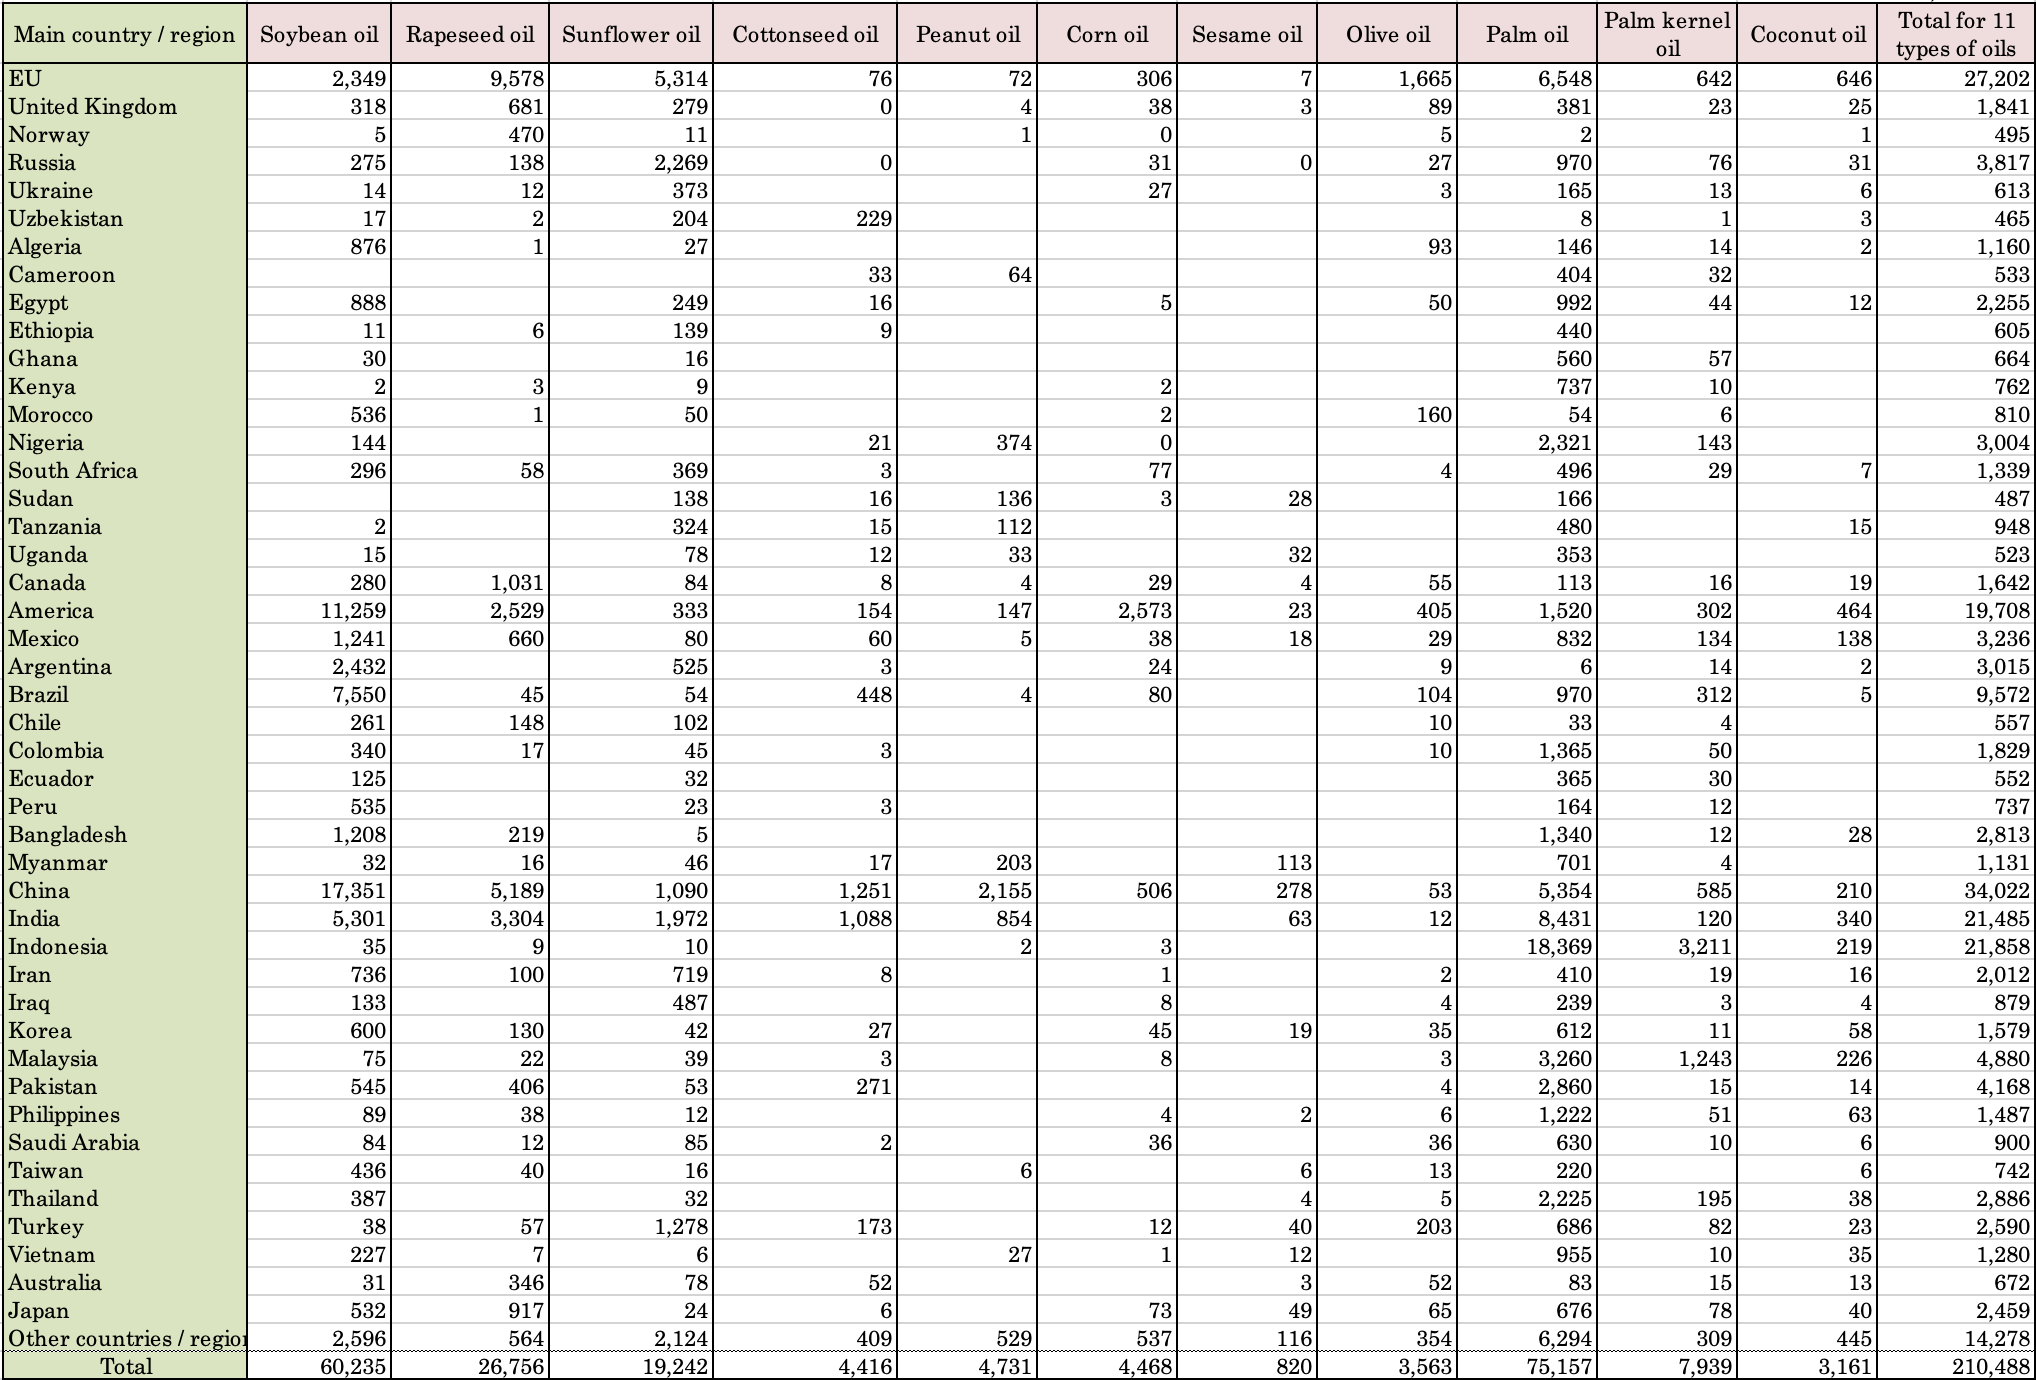
(Fiscal 2022/23)
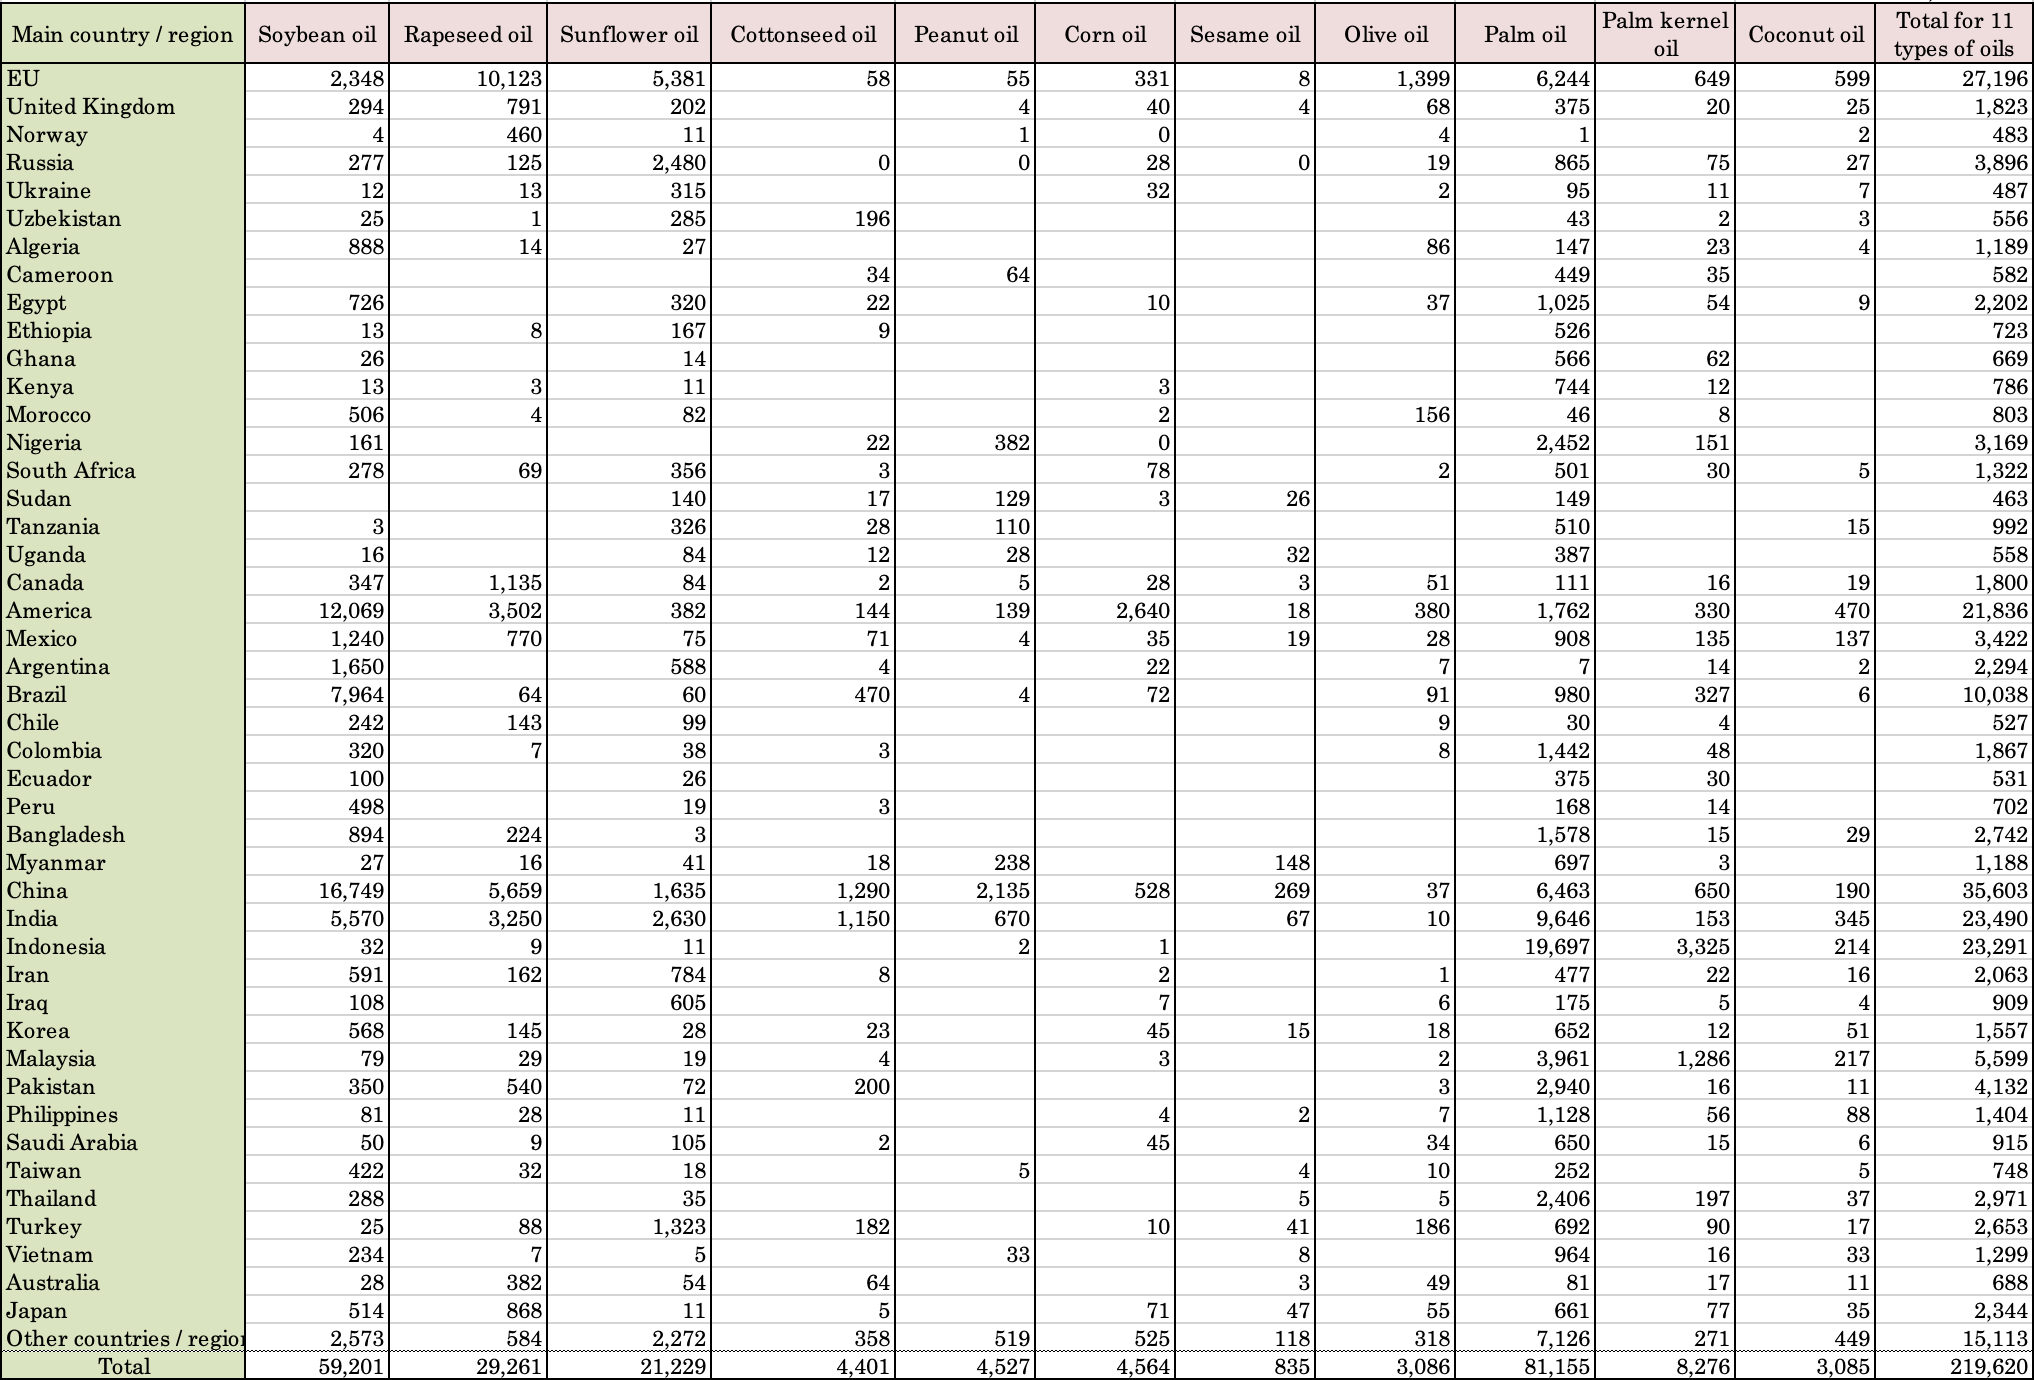
(Fiscal 2023/24 forecast)
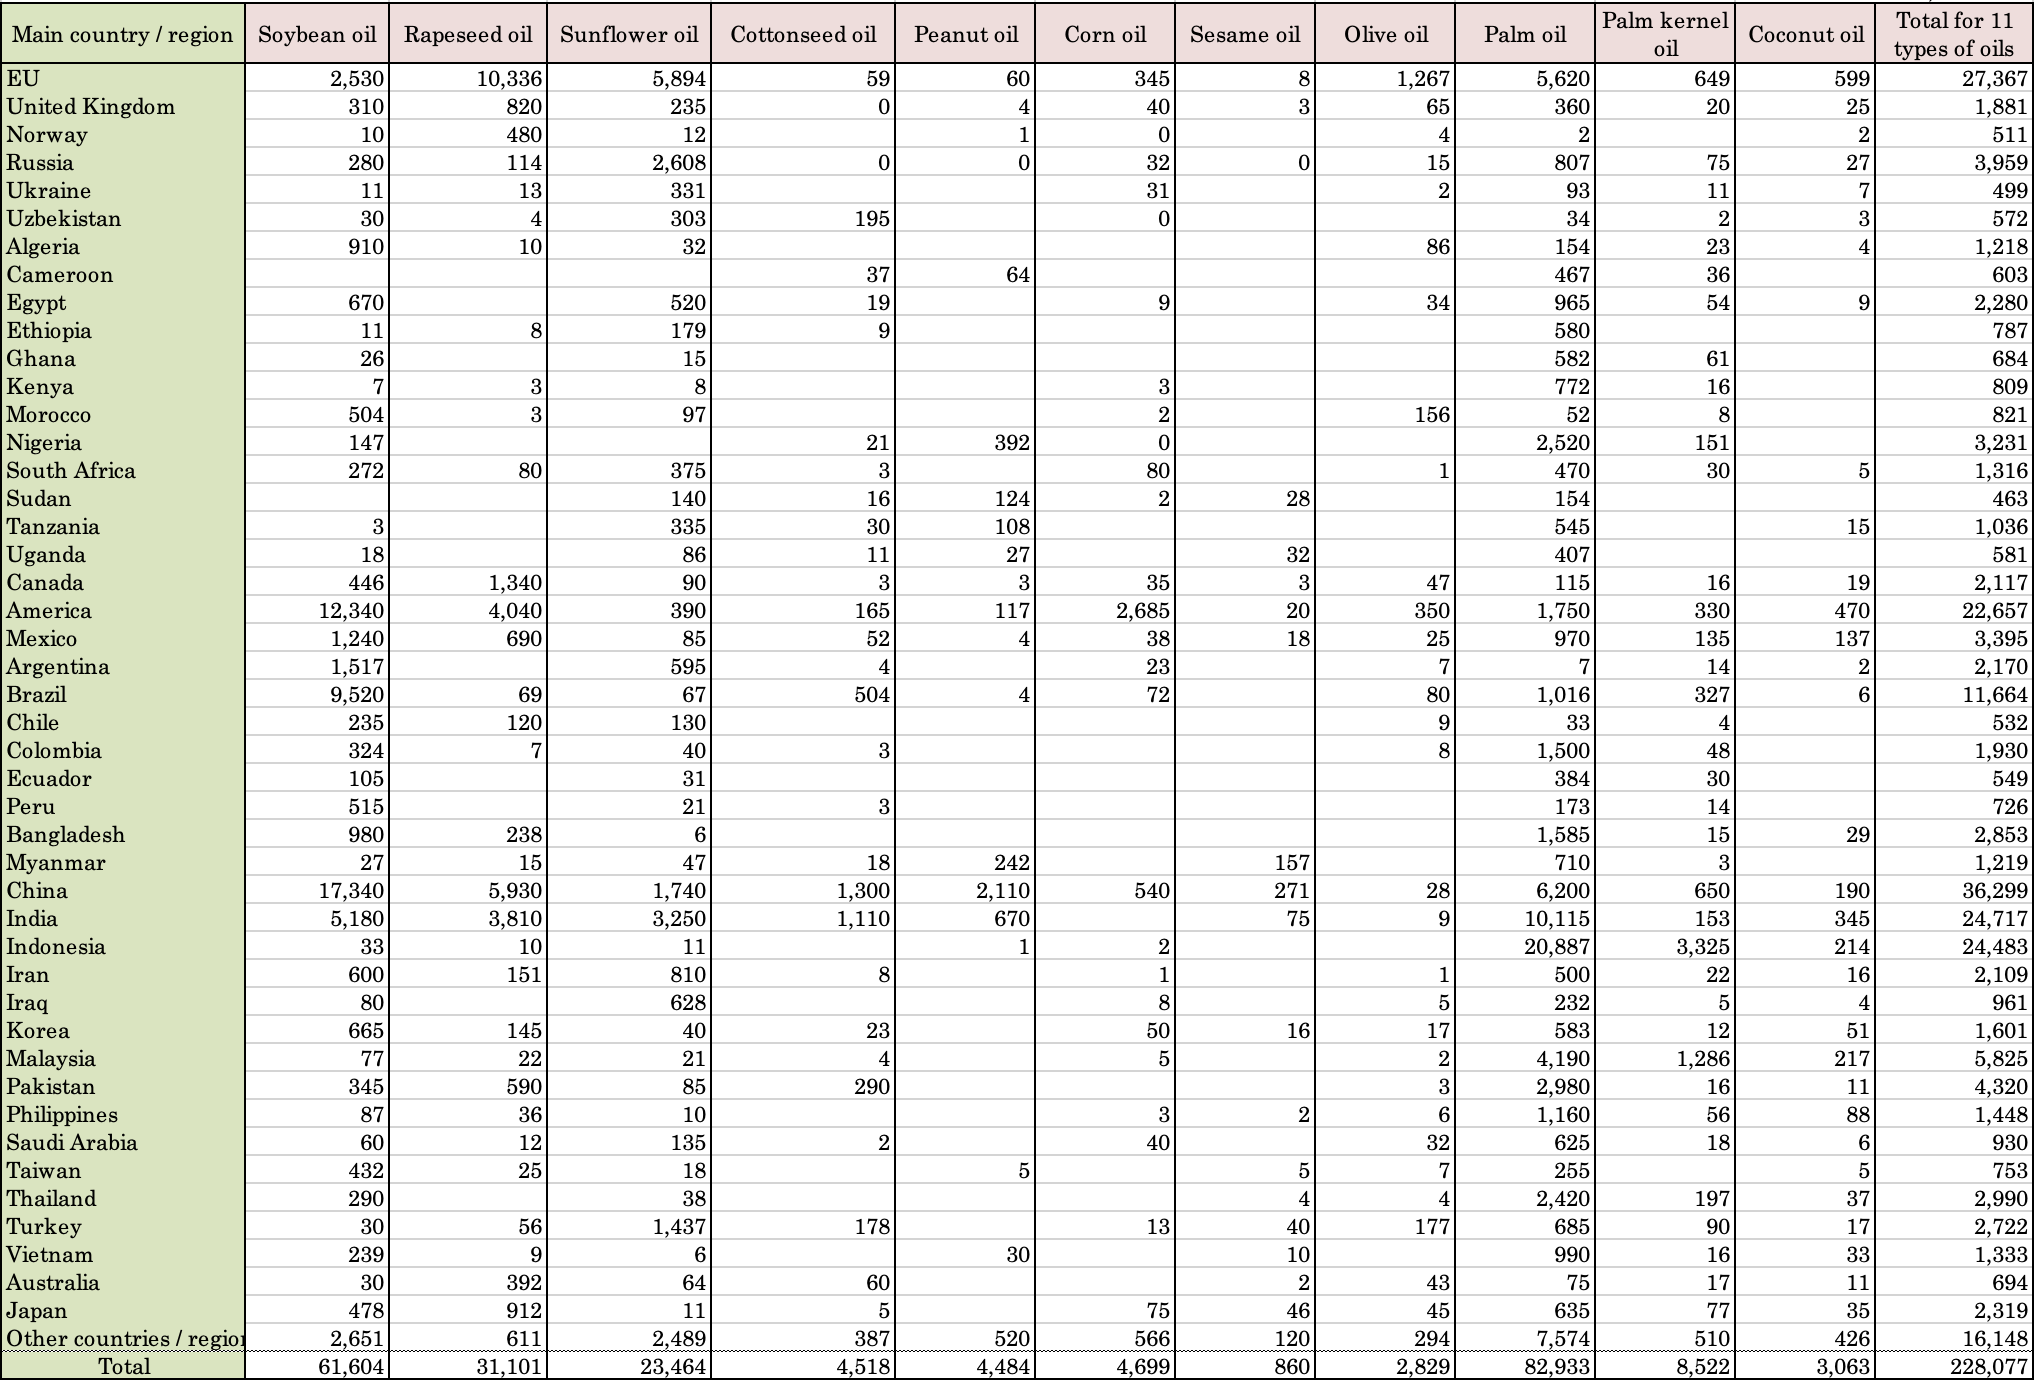
Table 15: Changes in production amount for biodiesel by country
(Unit: Million tons)
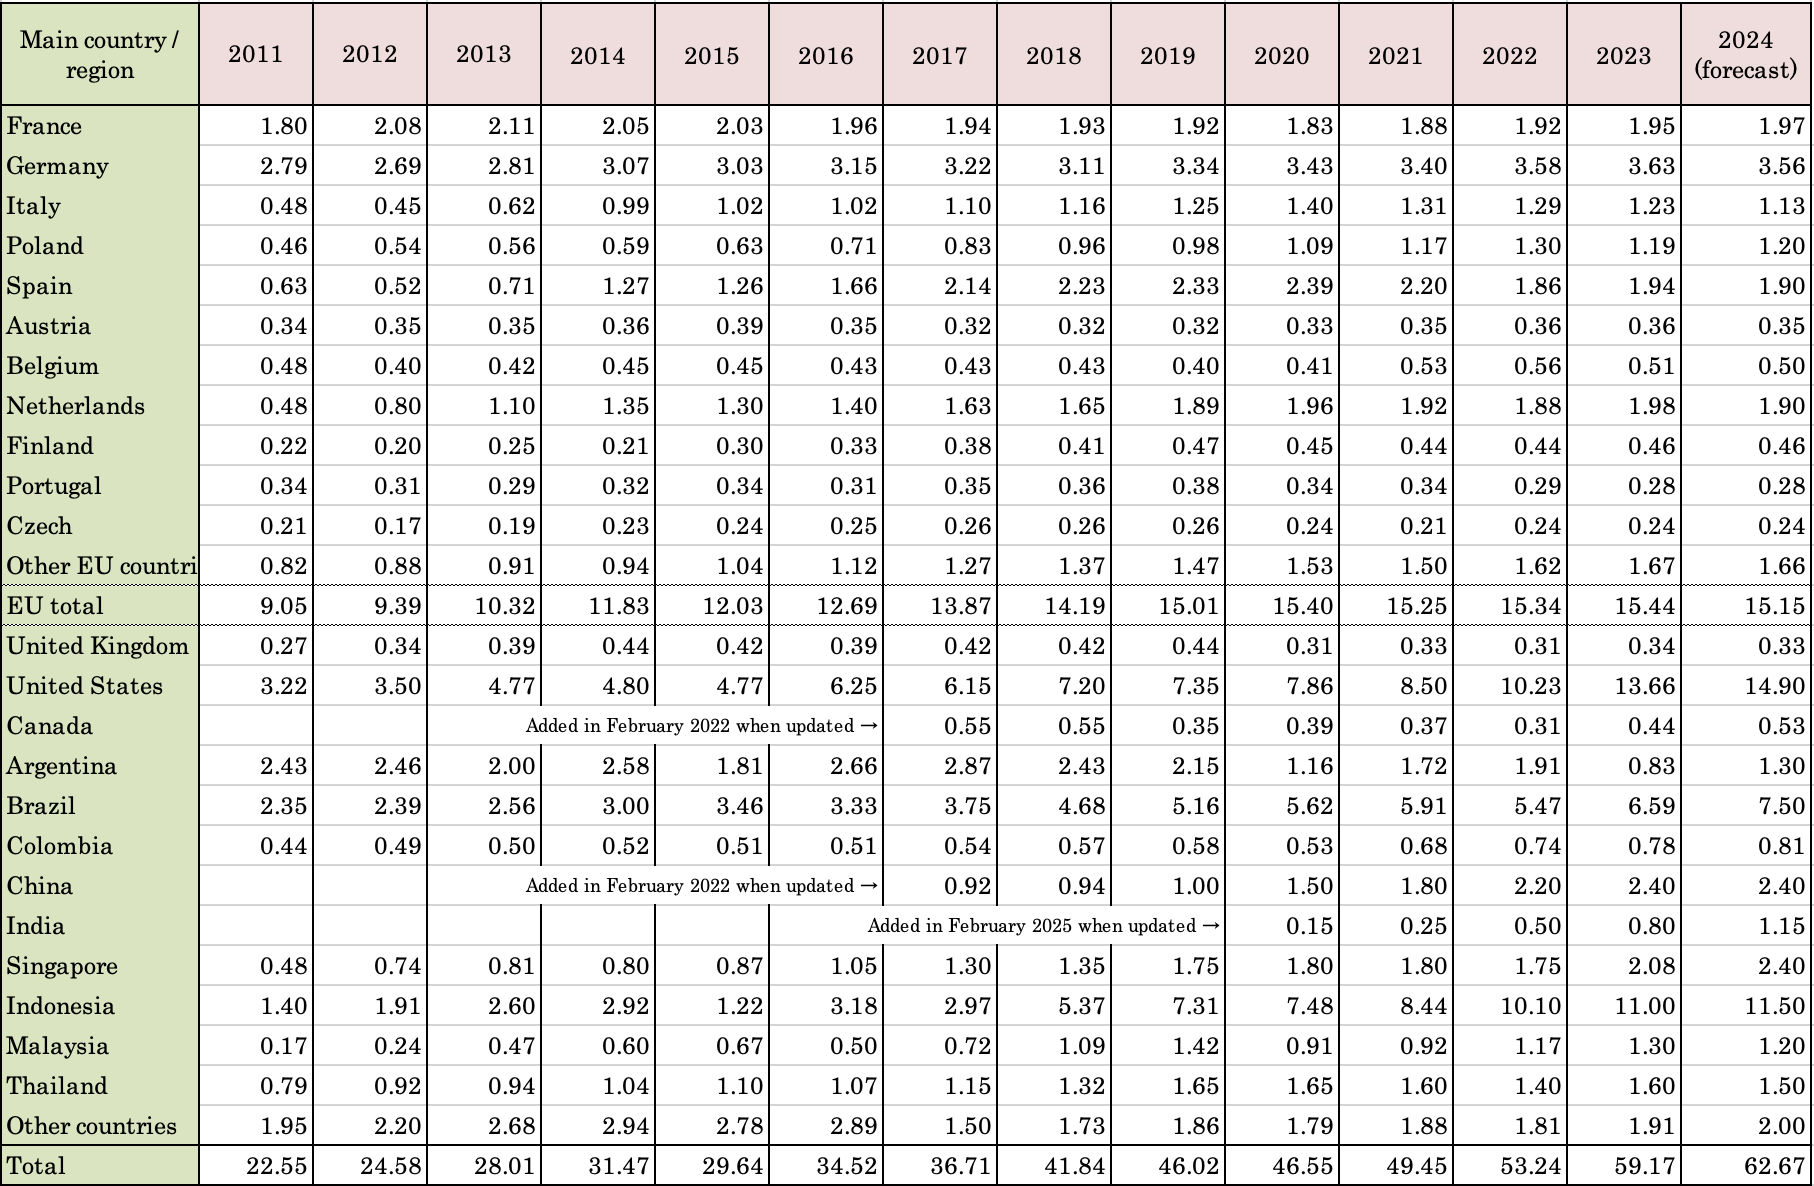
Table 16: Changes in biodiesel production amount by type of oil raw material
(Unit: Million tons)
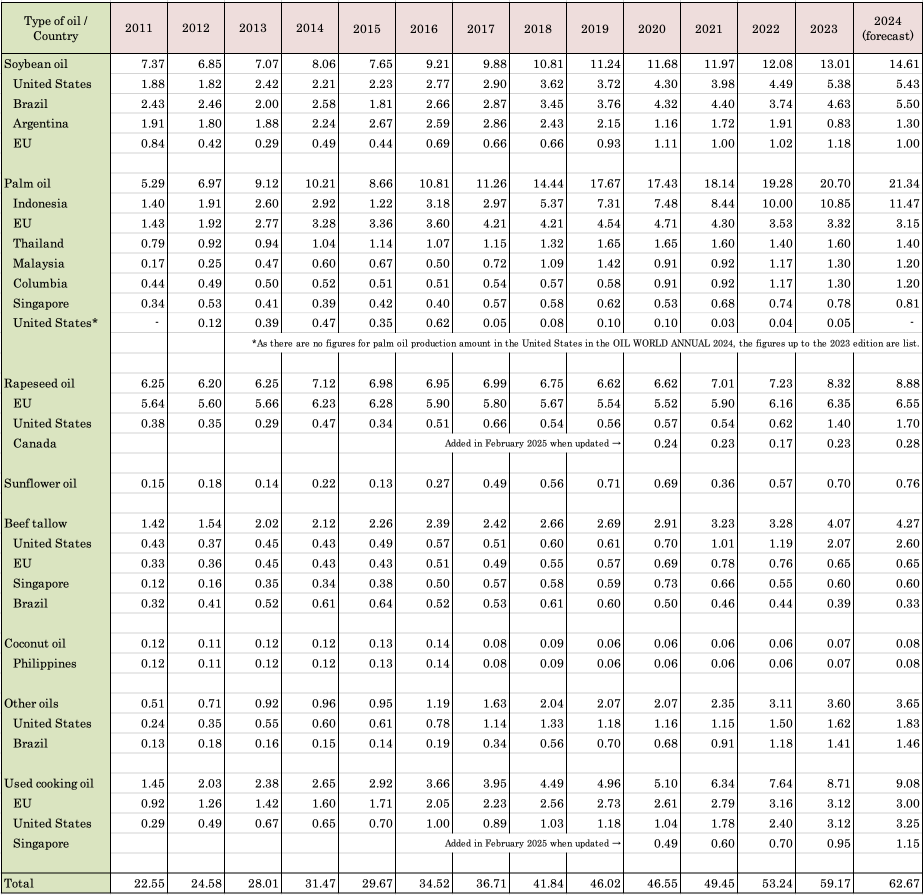
Table 17: Changes in production amount of soybean meal by country
(Unit: 1,000 tons)
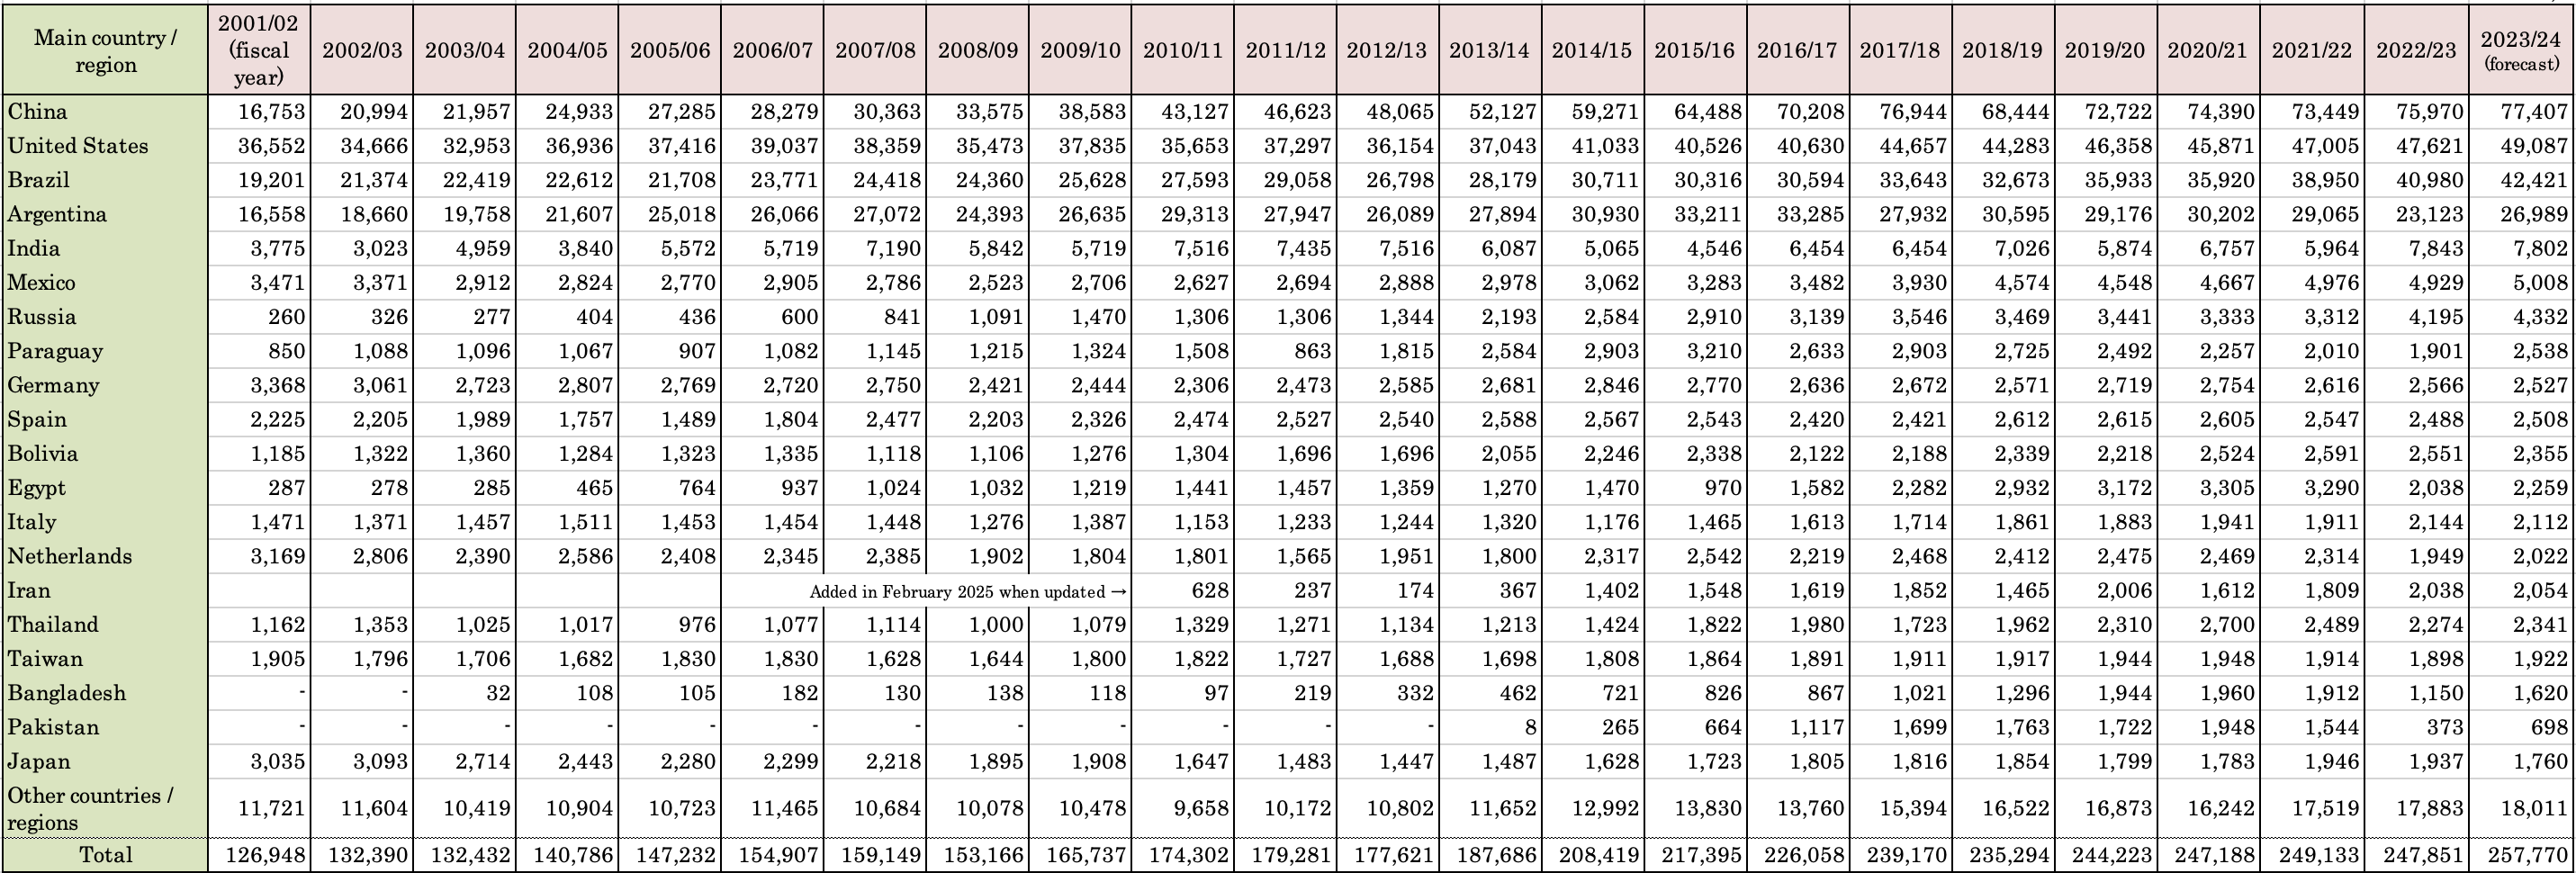
Table 18: Changes in traded amount of soybean meal by main countries
(Unit: 1,000 tons)
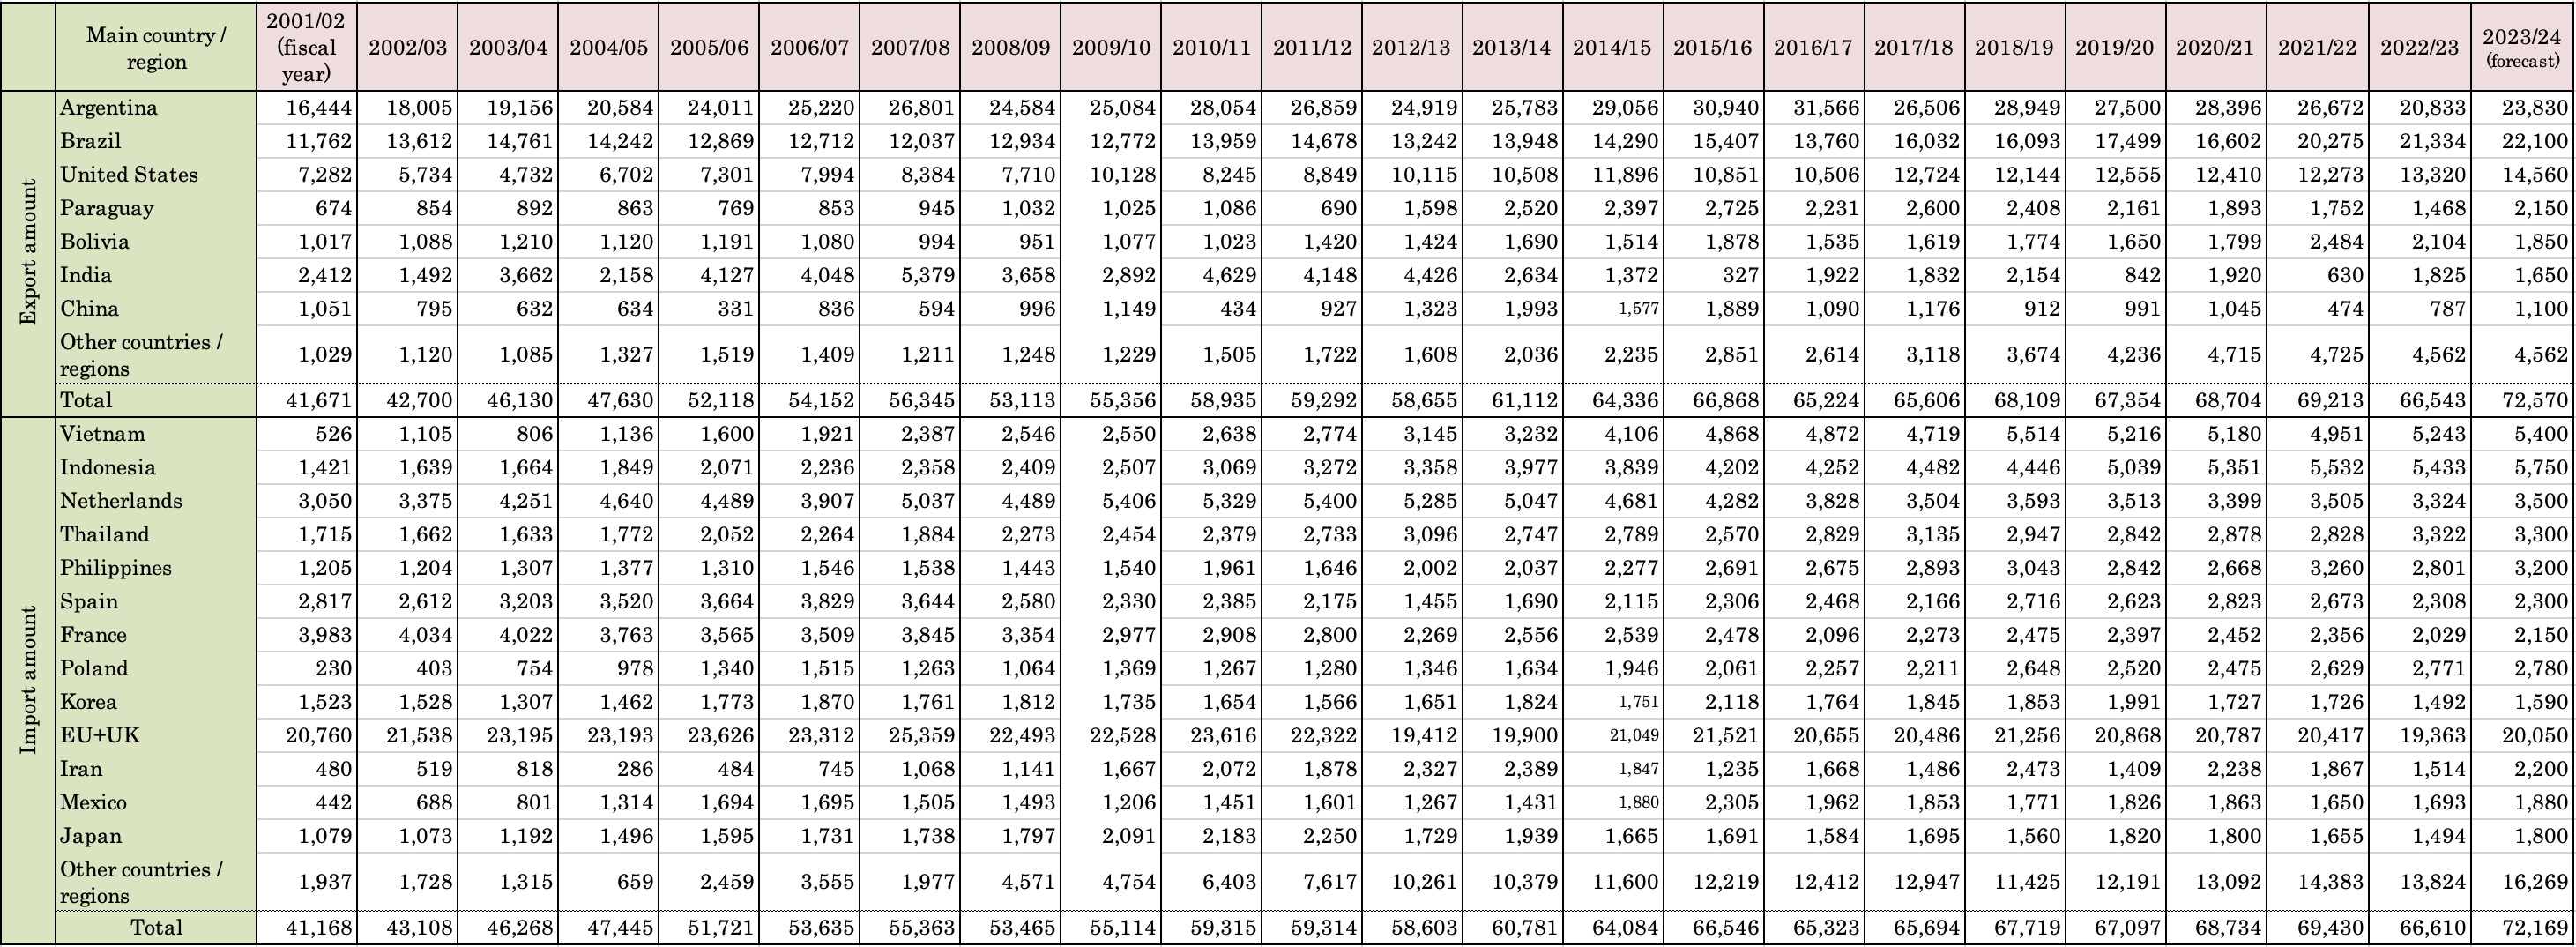
Table 19: Changes in amount of soybean meal consumed by country
(Unit: 1,000 tons)

Table 20: Changes in amount of meat produced by main country
(Unit: 1,000 tons)

Table 21: Changes in prices for "three soybean products" on the CBOT (settlement date in delivery month)

Source: Chicago Board of Trade
Note: Price on the settlement date of the delivery month (final price)
Table 22: Changes in amount of raw materials processed (expressed) in Japan
(Unit: 1,000 tons)
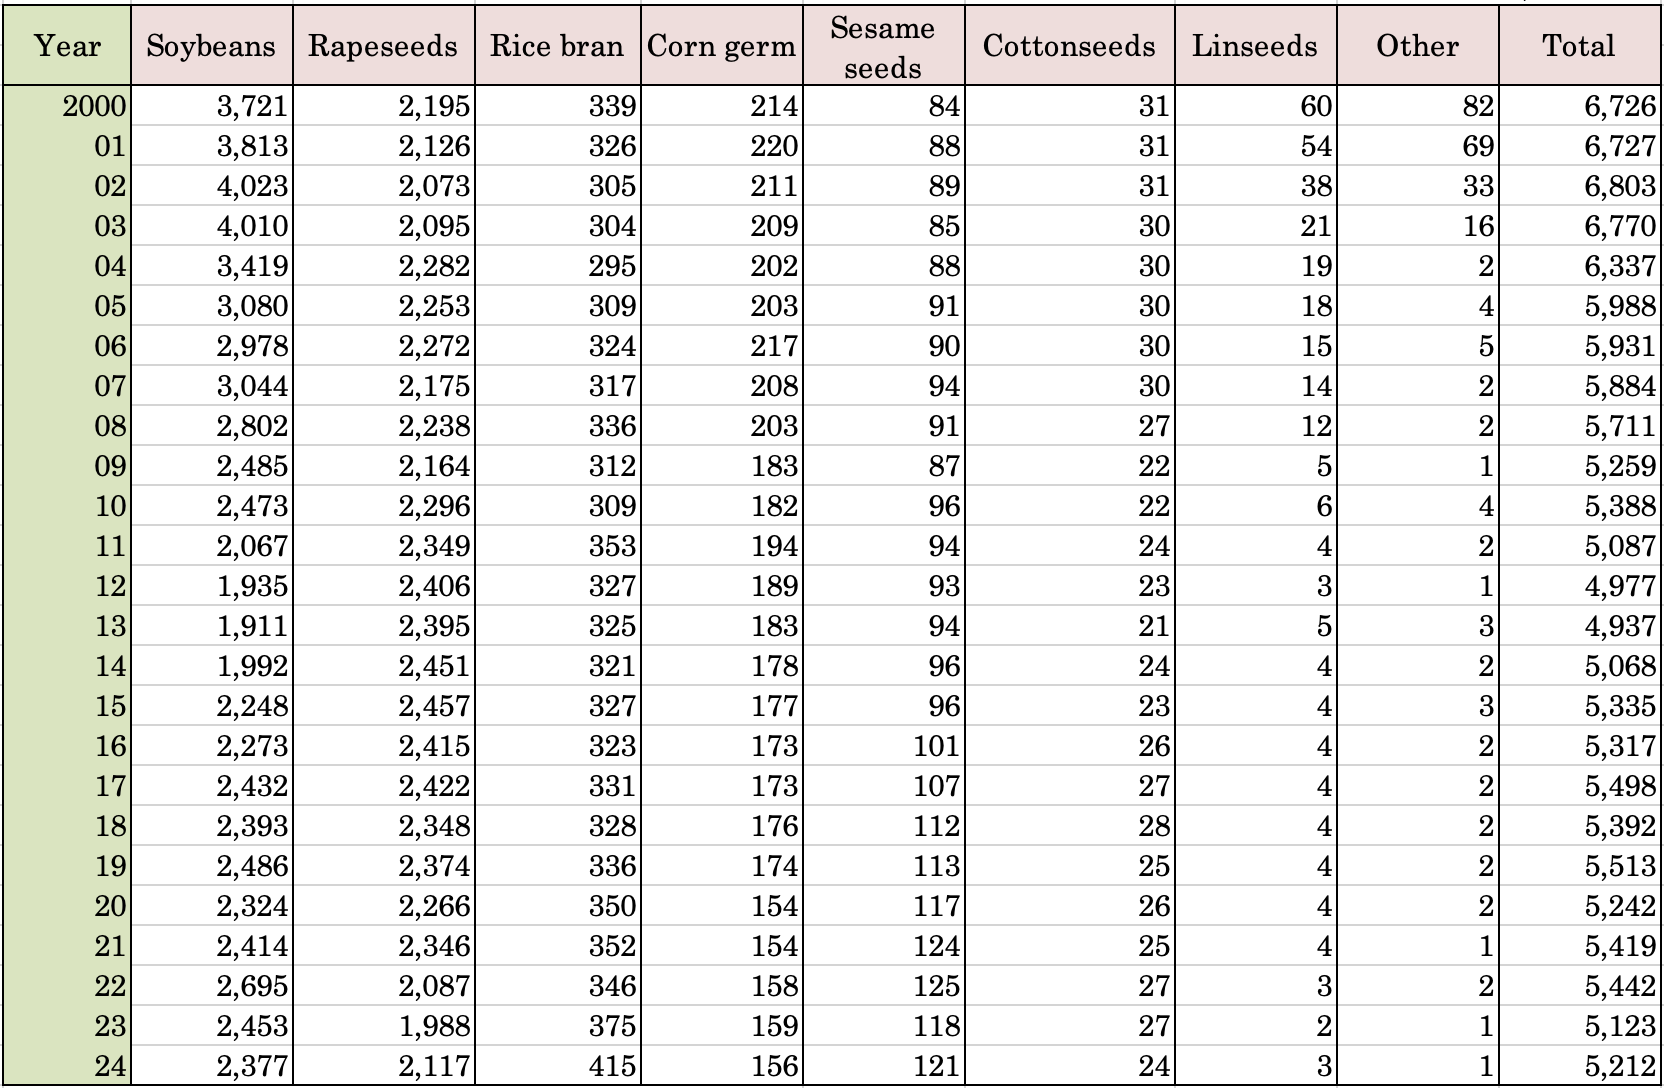
Source: Survey on Oil Production Results (MAFF)
Table 23: Changes amount of oilseeds imported by Japan
(Unit: 1,000 tons)
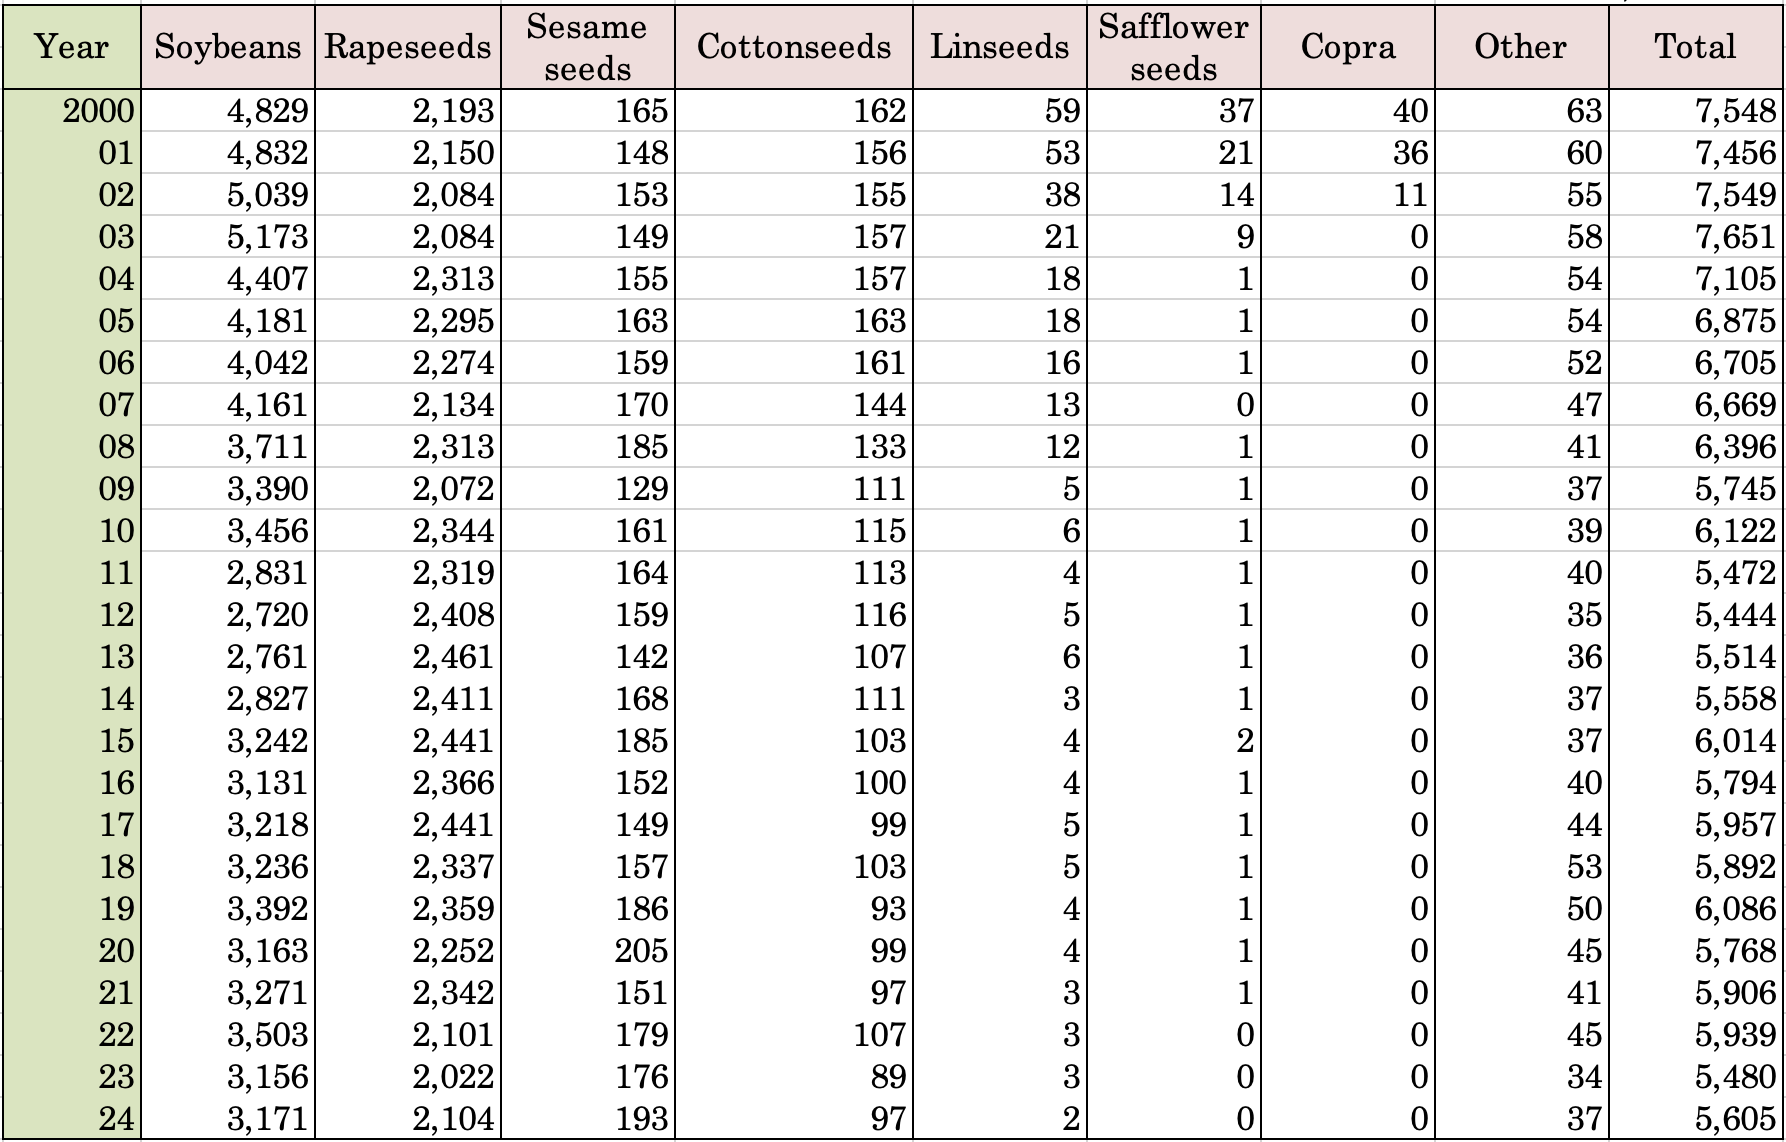
Source: Trade Statistics (MOF)
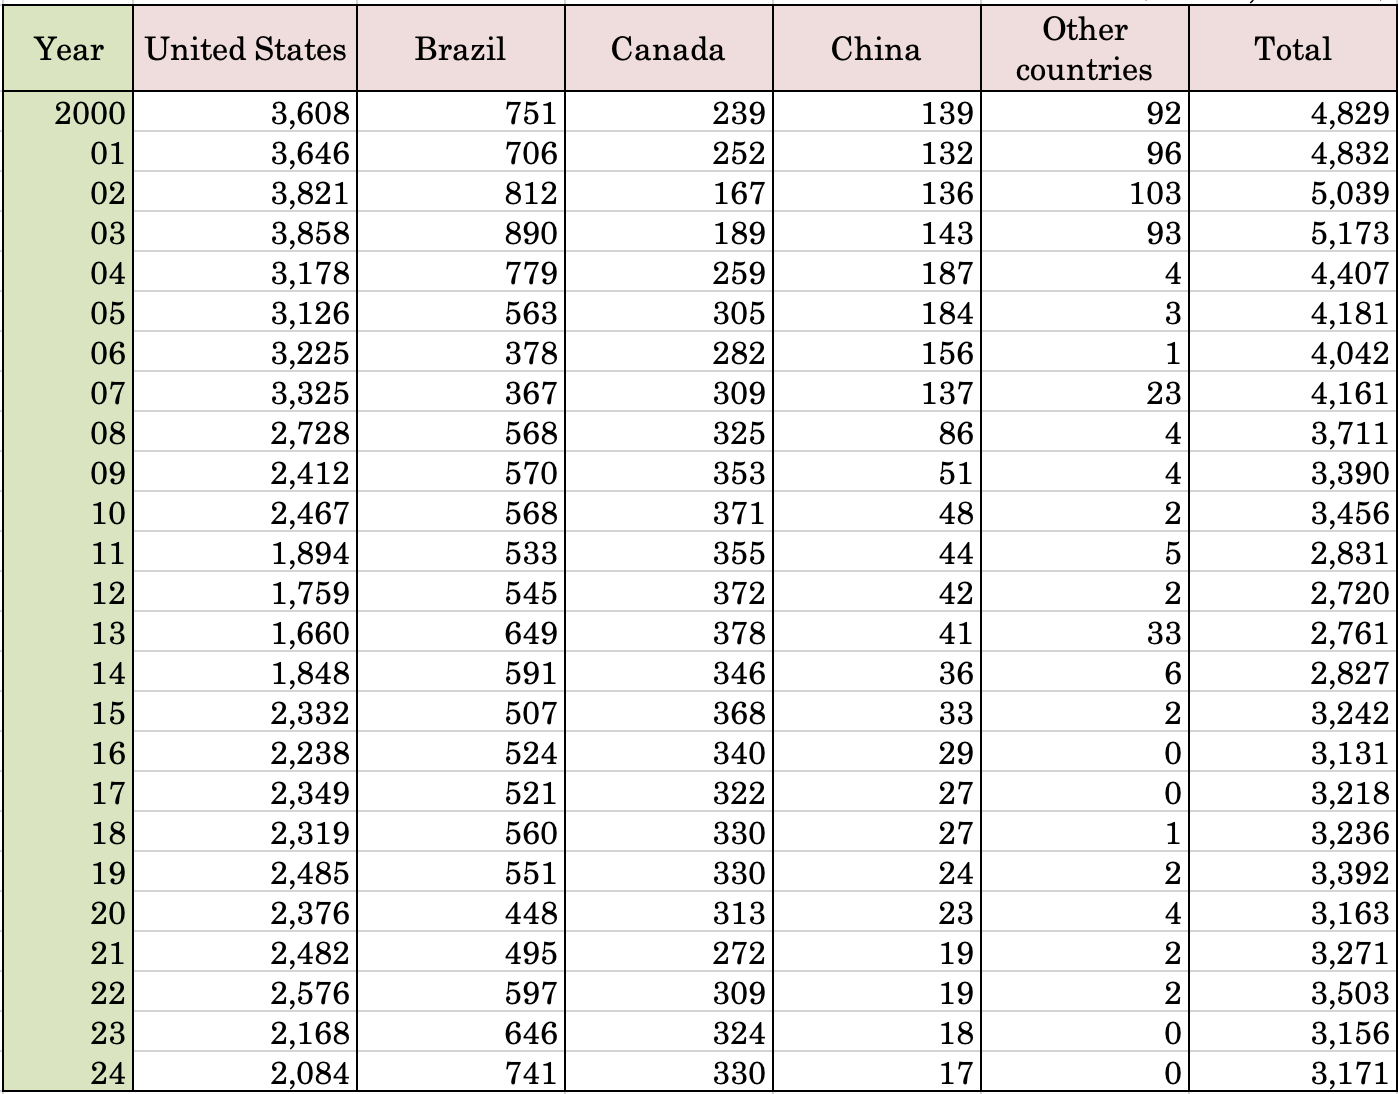
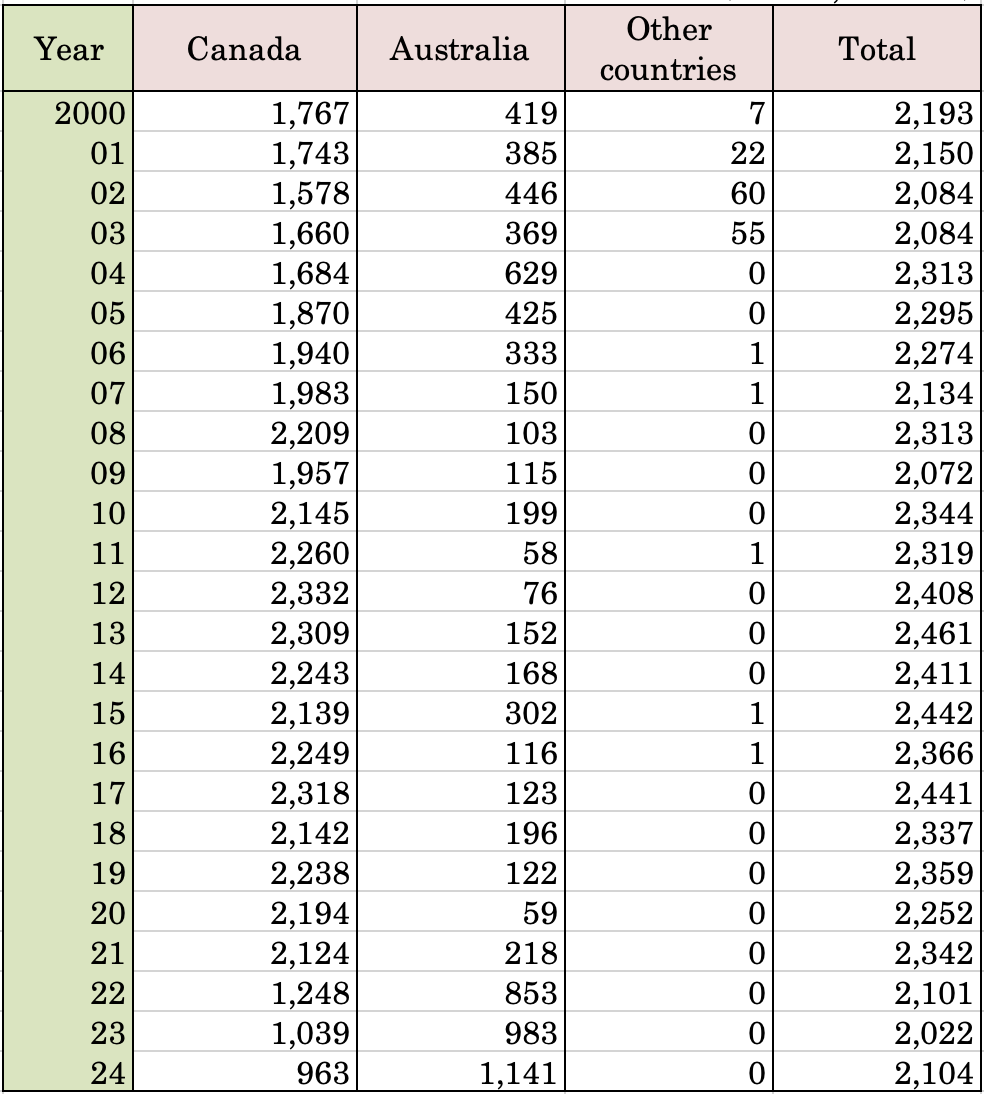
Table 24: Amount of soybeans, rapeseeds, and sesame seeds imported by country
(1) Changes in amount of soybeans imported by country
(Unit: 1,000 tons)
Source: Trade Statistics (MOF)
(2) Changes in amount of rapeseeds imported by country
(Unit: 1,000 tons)
Source: Trade Statistics (MOF)
(3) Changes in amount of sesame seeds imported by country
(Unit: tons)
(Unit: tons)
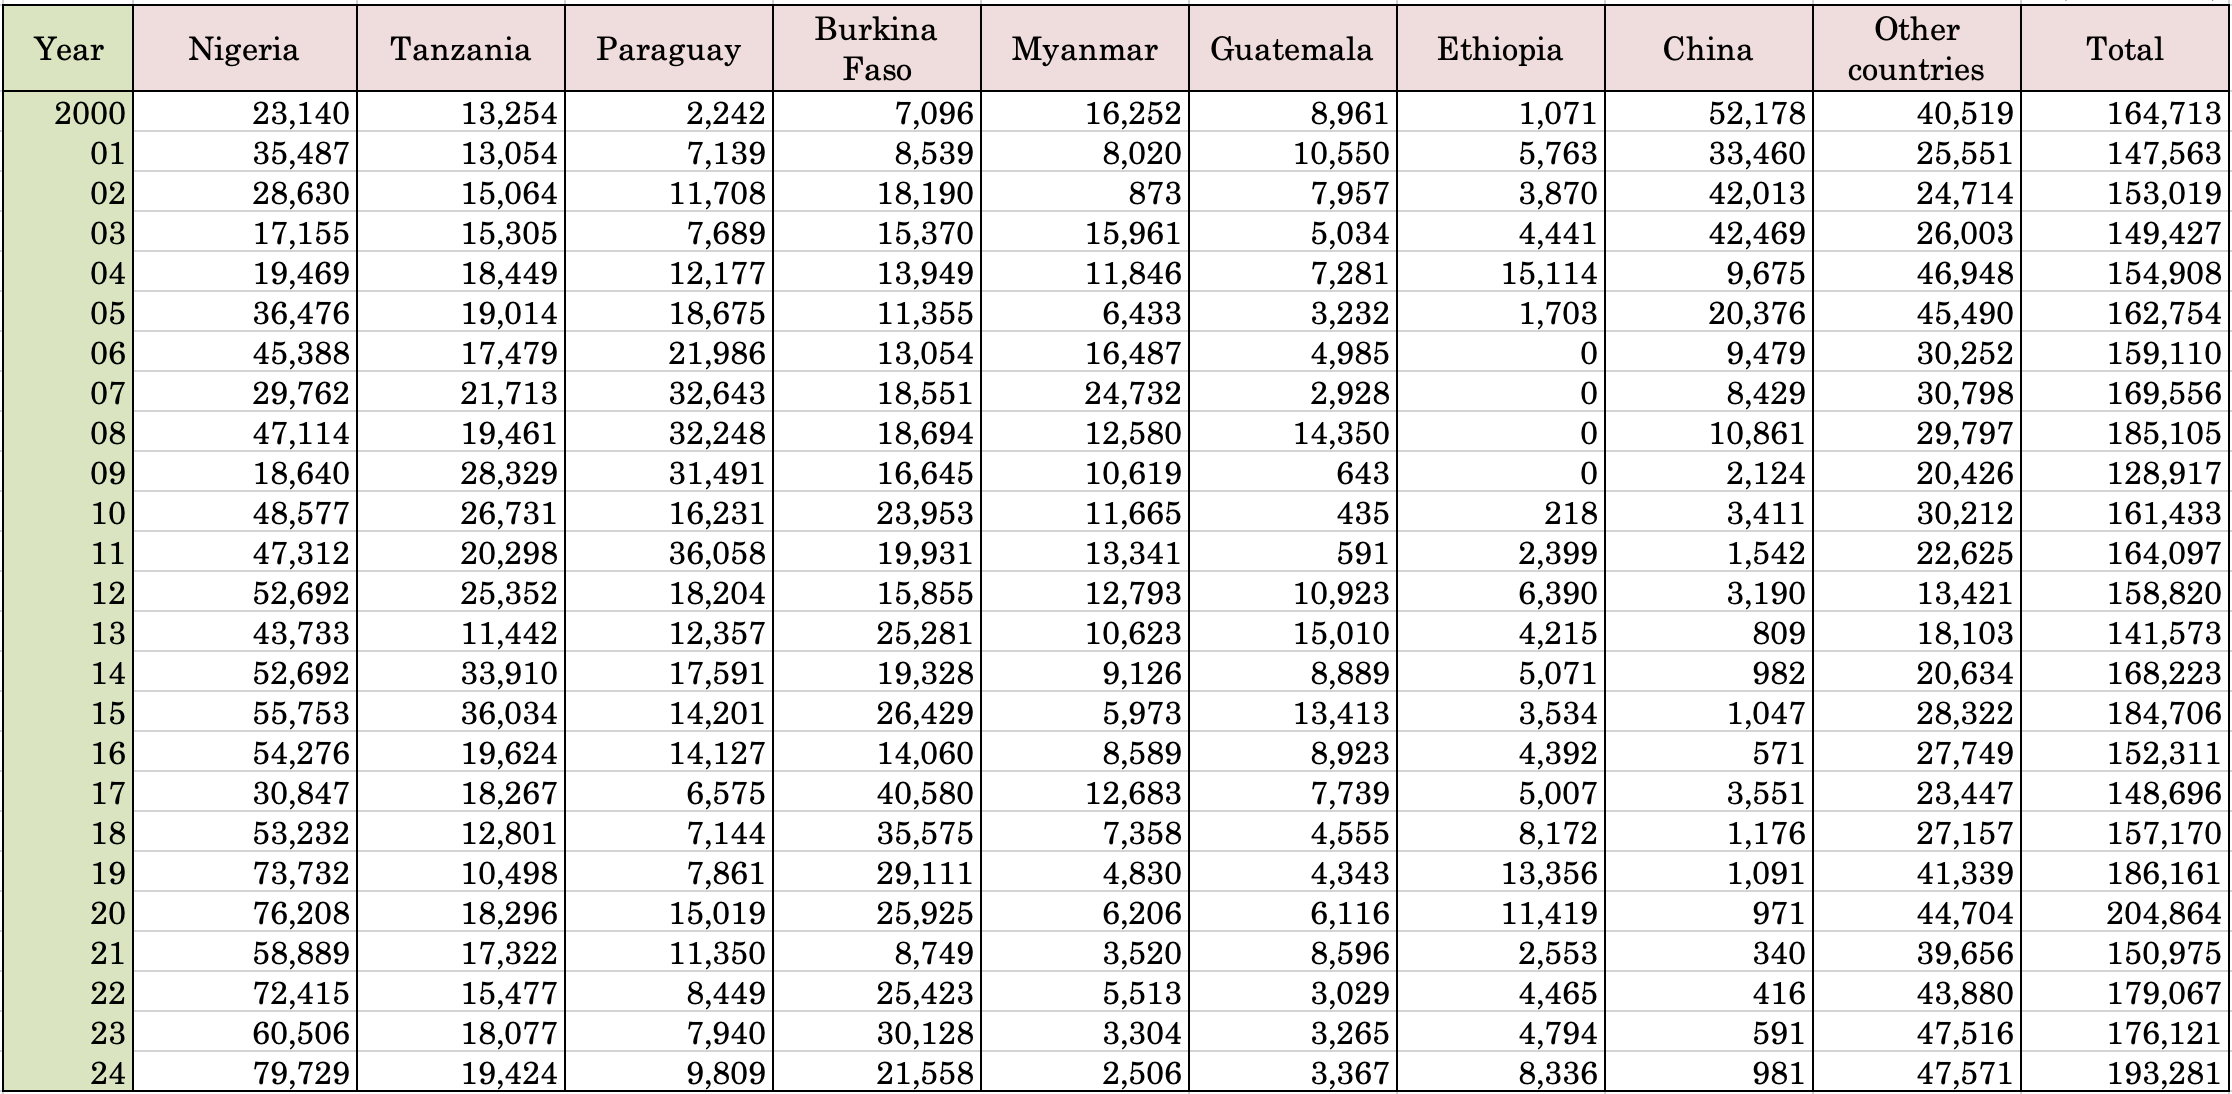
The main countries included in "Other countries"

Source: Trade Statistics (MOF)
Table 25: Changes in amount of vegetable oil produced in Japan (by type of oil)
(Unit: 1,000 tons of crude oil)

Source: Survey on Oil Production Results (MAFF)
Table 26: Changes in amount of vegetable oil imported by Japan (by type of oil)
(Unit: 1,000 tons)

Source: Trade Statistics (MOF)
Table 27: Changes in amount of vegetable oil supplied in Japan (by type of oil)
(Unit: 1,000 tons)

Source: Survey on Oil Production Results (MAFF), Trade Statistics (MOF)
Table 28: Changes in amount of soybean meal and rapeseed meal produced in Japan
(Unit: 1,000 tons)
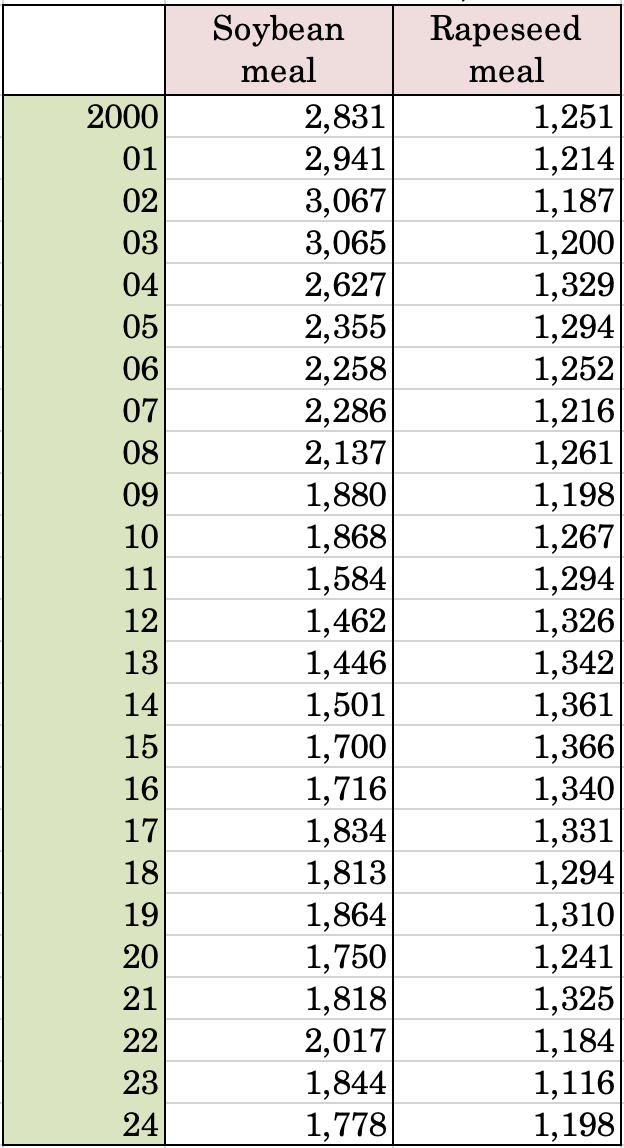
Table 29: Changes in total amount of soybean meal supplied in Japan
(Unit: 1,000 tons)
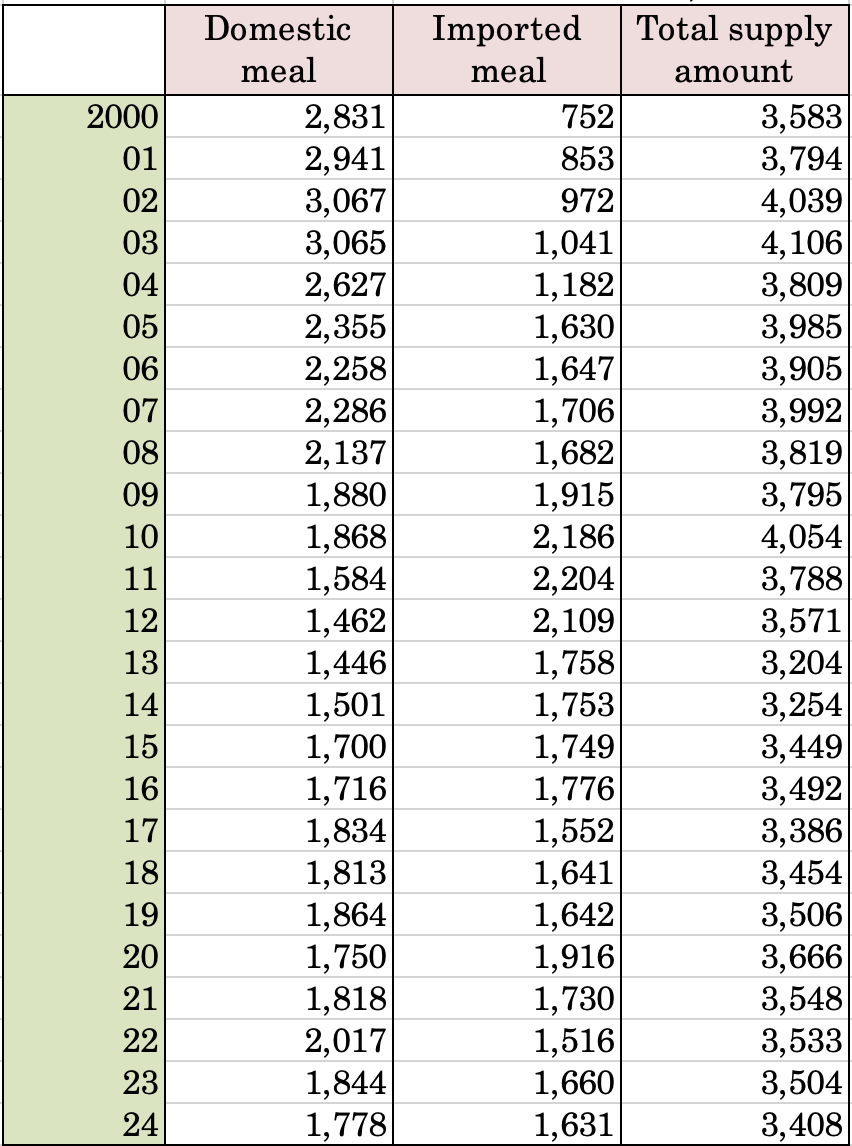
Table 30: Changes in supply and demand of vegetable oil in Japan
(Unit: 1,000 tons (unless otherwise specified))
