"Please give me statistics on the consumption of vegetable oil in the country of XXXX."—We often receive this kind of inquiry. However, with the exception of certain items such as amount purchased by households, there are no macro statistics for consumption.
Theoretically speaking, the amount of vegetable oil consumed can be expressed through the following formula.
Amount of vegetable oil produced + Imported amount ― Exported amount ± Change in inventory = Amount of vegetable oil consumed
In actuality, rather than the amount consumed, this formula expresses the total amount of supply circulating in the market. When using Japan as an example, statistics on production amount and inventory amount are calculated by the MAFF based on reports from oil-producing corporations. The import/export amount is calculated from customs statistics provided by the MOF. However, the inventory amount at the time of distribution is not known.
Moreover, the quantity obtained from this formula is not the quantity for direct consumption; rather it includes the amount supplied as raw materials to the food processing industry and other industries. For example, in addition to being consumed and exported as edible oil, palm oil from Malaysia is also processed further for production and export of food products and fatty acids. The formula given above includes all of these uses in the amount of vegetable oil consumed. Accordingly, the formula is more reflective of the total domestic supply amount rather than the amount consumed. A more accurate term might be the "amount processed domestically." However, in this section, we will use the term "consumption amount" in our explanation.
Consumption that exceeds the amount produced is impossible. Therefore, changes in the consumption amount for different types of oil coincide with changes to the production amount. This section introduces the status of consumption by country and region for 11 types of vegetable oil (castor oil and linseed oil are mainly used in industry and are therefore excluded from the 13 types of oil) that are mainly used as edible oil.
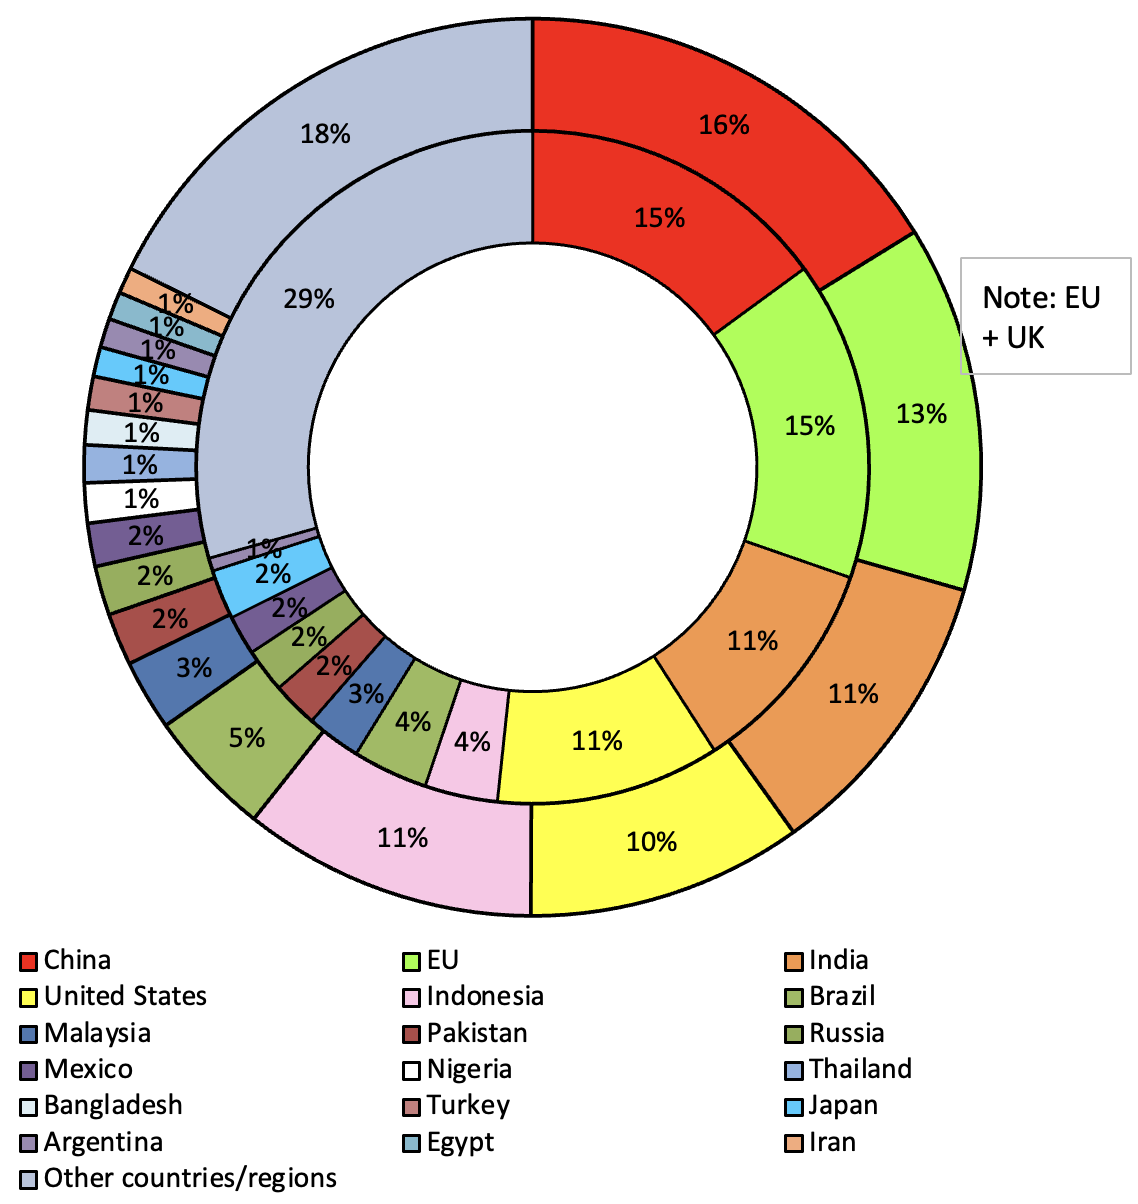
Figure 9 shows changes in the overall consumption ratio for the 11 types of vegetable oil by country/region. In fiscal 2001-2002, half of global consumption of vegetable oil was attributed to the top 12 countries. However, in 2022-2023, consumption in these countries has grown to reach more than 70% of the total amount. Figure 9 applies to vegetable oil that is mainly used as edible oil. Accordingly, the total consumption amount increases at roughly the same pace as population. In China, India, and other countries with a large population, even a slight increase in the per capita production amount clearly leads to a hug increase in the overall consumption amount for that country. Note that despite having a small population, Malaysia is among the top countries in terms of consumption. This is because the consumption amount includes amounts used in the palm oil processing industry.
Figure 9: Changes in the ratio of vegetable oil consumption by country/region
(Inner circle: 2001-2002; Outer circle: 2022-2023)

Source: Same as Figure 1
Note: The total consumption amount was 97,402,000 tons in 2001-2002 and 219,620,000 tons in 2022-2023
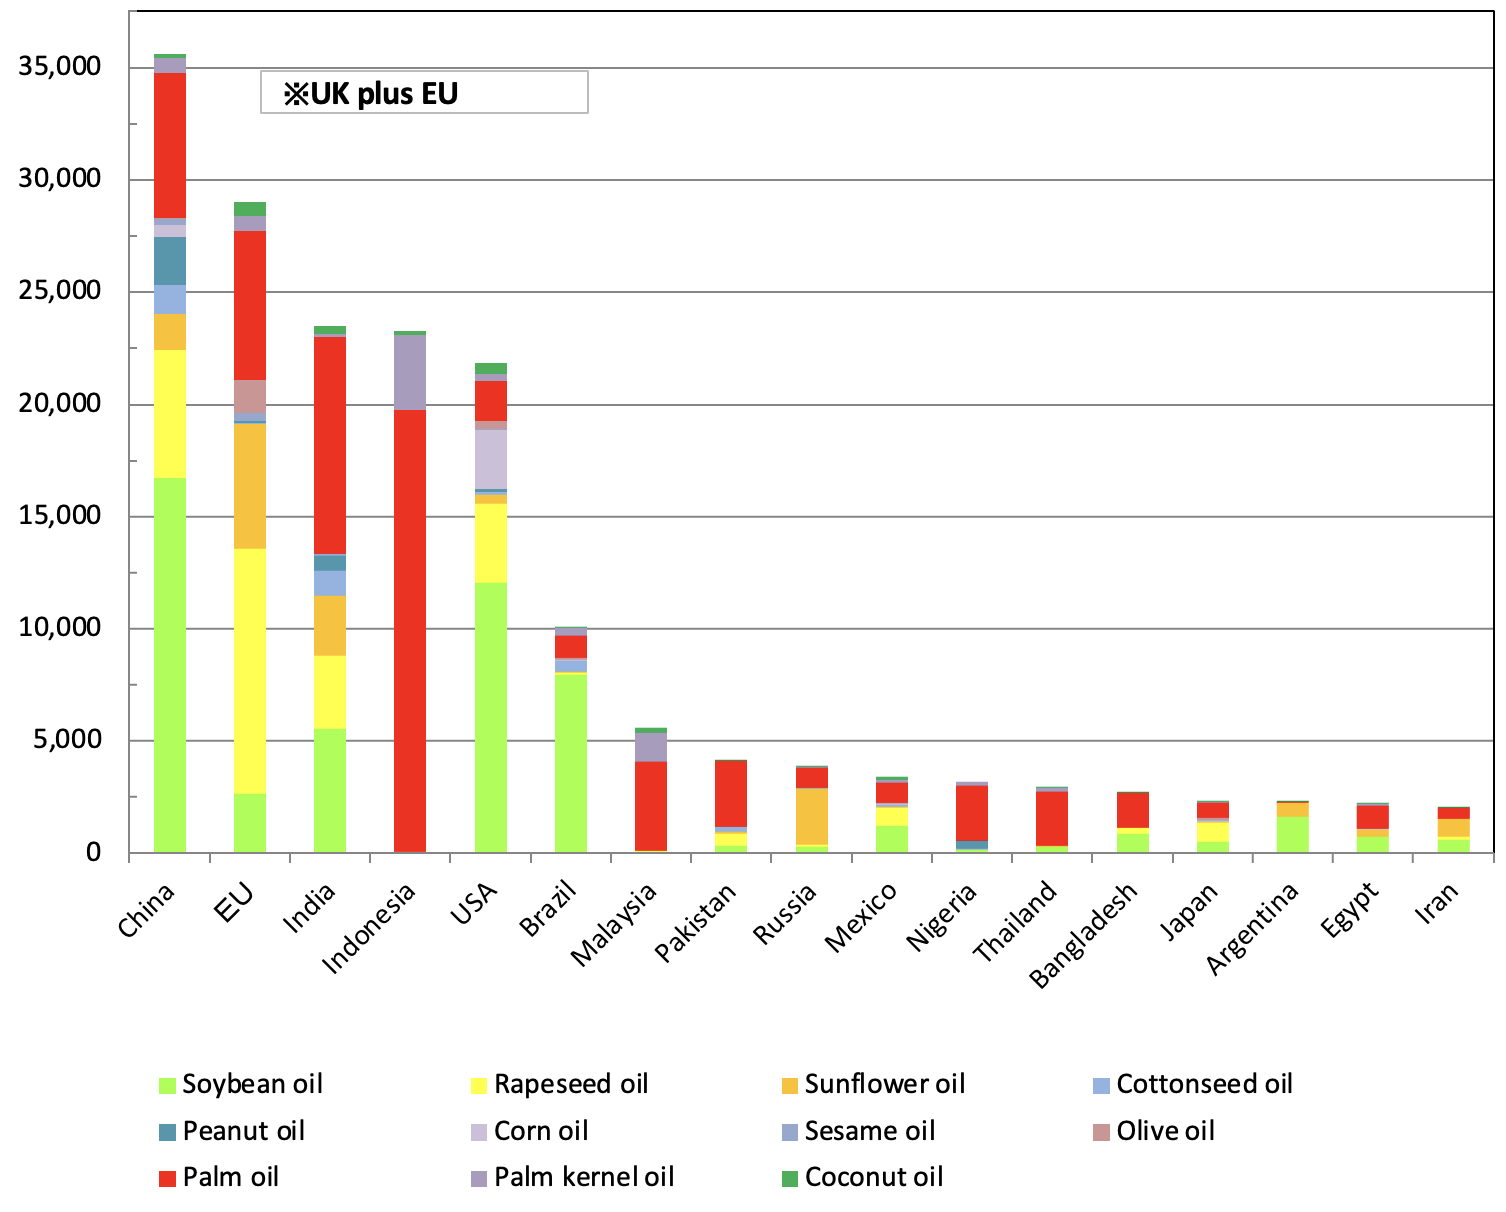
Next, Figure 10 shows what types of vegetable oil is consumed in these main countries/regions. As you can see, countries which produce oilseeds also consume the greatest amount of vegetable oil in types which come from the oilseeds produced in that country. Specifically, soybean oil is the most widely-consumed oil in the United States, Brazil, and Argentina; rapeseed oil, sunflower oil, and olive oil in the EU; and palm oil in Malaysia and Indonesia. In contrast, China consumes various types of oil consisting of domestically-produced and imported raw materials and oils. Various types of oil are also consumed in Japan and Mexico, countries which are highly dependent on imports. In Argentina, which rivals Russia as the largest producer of sunflowers, the most widely-used vegetable oil in 2001-2002 was sunflower oil. However, in conjunction with an increase in soybean production, a greater amount of soybean oil is recently consumed in Argentina, thus leading to major changes in the structure of oil consumption.
Figure 10: Consumption amount by type of oil in main countries (2022-2023)
(Unit: 1,000 tons)

Source: Same as Figure 1


